Try it on your own data
Every report in this article is in the free plan. One snippet for web and apps, up to 10 sites.
Start freeMarketing dashboards often show everything the ad platforms report and answer little. This guide lists the five sections worth including, walks through a sample channel table with spend, sign-ups and CPA, and explains blended vs channel numbers and attribution.
What you will learn
- Lead with outcome: conversions and cost per conversion by channel, against target
- Blended CPA shows the total; channel CPA shows where the next dollar should go
- Use one conversion and one attribution rule across all rows, and note the rule on the page
What a marketing dashboard is for
A marketing dashboard brings the numbers that describe marketing performance into one view, so you can see each week which channels and campaigns bring customers, at what cost, and what changed. It is not a place for every metric your tools can produce. A good one answers:
- Are we on track against this month's targets?
- Which channels bring conversions, and what does each conversion cost?
- Which campaigns are working, and which should stop?
- What changed since last period, and why?
Five sections to include
The table below lists the sections, the main numbers in each and how often to look.
| Section | Main numbers | Review |
|---|---|---|
| 1. Targets | Conversions, pipeline or revenue vs this month’s target | Weekly |
| 2. Channels | Sessions, conversions, conversion rate, CPA by channel | Weekly |
| 3. Campaigns | Spend, conversions, CPA, ROAS per campaign | Weekly while live |
| 4. Funnel | Visit → sign-up → activated → paid, by channel | Monthly |
| 5. Trend and notes | Main KPI over 13 months with annotations | Monthly |
Every number needs a comparison: last period, target or the same period last year.
A sample channel table
One month for a SaaS product (sample numbers):
| Channel | Spend | Sessions | Sign-ups | Conversion rate | CPA |
|---|---|---|---|---|---|
| Paid search | $12,000 | 9,600 | 240 | 2.50% | $50.00 |
| Paid social | $8,000 | 12,800 | 128 | 1.00% | $62.50 |
| $600 | 3,200 | 96 | 3.00% | $6.25 | |
| Organic search | — | 18,400 | 236 | 1.28% | — |
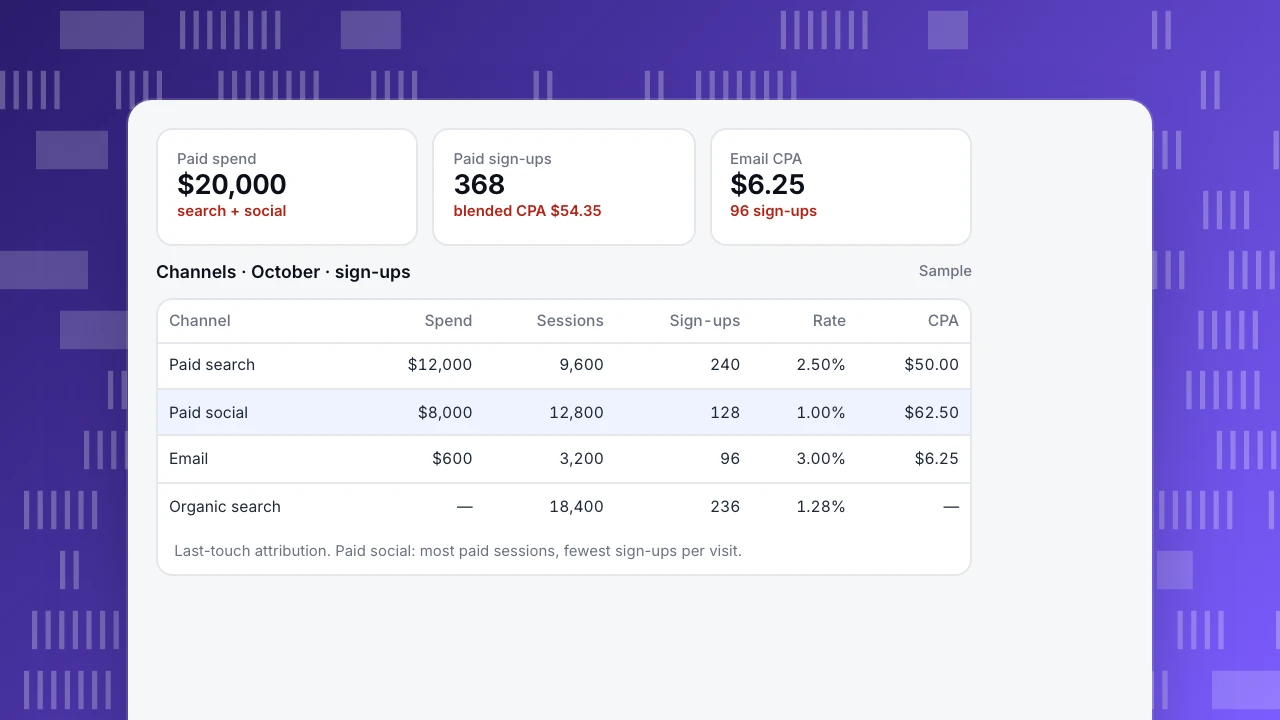
Reading it: paid social brings the most paid sessions but the fewest sign-ups per visit, and each sign-up costs $62.50. Email is small but very cheap. Paid channels together cost $20,000 for 368 sign-ups, a blended CPA of $54.35. That blended number hides the $12.50 gap between search and social.
Paid spend
$20,000
search + social
Paid sign-ups
368
blended CPA $54.35
Email CPA
$6.25
96 sign-ups
Channels · October · sign-ups
Sample| Channel | Spend | Sessions | Sign-ups | Rate | CPA |
|---|---|---|---|---|---|
| Paid search | $12,000 | 9,600 | 240 | 2.50% | $50.00 |
| Paid social | $8,000 | 12,800 | 128 | 1.00% | $62.50 |
| $600 | 3,200 | 96 | 3.00% | $6.25 | |
| Organic search | — | 18,400 | 236 | 1.28% | — |
Last-touch attribution. Paid social: most paid sessions, fewest sign-ups per visit.
Blended vs channel numbers
- Blended CPA (all spend ÷ all conversions) is what the budget holder sees. It is useful for the total, but it hides which channel to cut.
- Channel CPA tells you where the next dollar should go. Compare channels on the same conversion and the same attribution rule.
- Attribution changes the table. Last-touch credits the final click; first-touch credits discovery. Social often looks weak on last-touch and stronger on first-touch. Pick one rule for the dashboard and note it on the page.
Common mistakes
- Mixing goals. Sign-ups for one channel, purchases for another. Use the same conversion across rows.
- Showing reach without outcome. Impressions and followers belong in a channel report, not the main dashboard.
- No comparison. Every number needs a reference: previous period, target or same period last year.
- Untagged traffic. Campaigns without UTM tags land in direct or referral and make paid channels look worse. See marketing campaign analysis.
- Too many tiles. Keep the first screen to what you review weekly; see marketing KPIs.
Building it in TapCub
- Channels and campaigns: Web analytics › Sources shows sessions and goal conversions by channel, source, medium and campaign from your UTM tags.
- Spend and cost per conversion: in All-platform analytics › Business › Channel ROI, upload spend on the Costs tab (CSV with day, channel, source, campaign, cost, currency, clicks, impressions). The ROI tab shows CPC (spend ÷ sessions), CPA (spend ÷ purchases from your order data) and ROAS per channel. For a sign-up CPA, divide spend by goal conversions.
- The dashboard: save the analyses you review weekly and put them in All-platform analytics › Overview › My dashboards; share a read-only link with people outside the project.
- Context: annotate campaign launches and budget changes so the trend lines explain themselves.
See also: What is martech? Categories, stack examples and how to manage it.
Was this article helpful?
We use your answers to fix and expand this page.
Couldn’t send. Please try again in a minute.
Thanks for the feedback. We’ll use it to improve this page.You’ve already sent feedback on this page. Thanks.

Growth Strategist
Explores acquisition channels, activation, and conversion experiments, turning data insights into actionable growth hypotheses and evaluation methods.