Try it on your own data
Every report in this article is in the free plan. One snippet for web and apps, up to 10 sites.
Start freeA marketing forecast turns a budget into expected traffic, leads, customers and revenue. This guide compares four methods, builds a funnel-based quarterly forecast with low, expected and high scenarios from a company’s own rates, and shows how to check forecast against actuals each month.
What you will learn
- Forecast a range with written assumptions, not a single number
- Build from your own historical rates at each funnel stage, and keep channels separate
- Compare forecast and actual at every stage monthly to see where the gap comes from
What a marketing forecast is
A marketing forecast estimates what your marketing will produce over a period: traffic, leads, customers, revenue. It turns a budget into expected results, so you can set targets, plan spend and notice early when things go off track.
A good forecast is a range with its assumptions written down, not a single number. "48 customers, likely between 32 and 66, assuming CPC around $2.50" is more useful than "50 customers".
Four methods
The table below compares four methods, from simplest to most demanding.
| Method | How it works | Needs | Best for |
|---|---|---|---|
| Run rate | Recent months × number of months | A few months of history | Stable channels, short horizons |
| Seasonal (last year × growth) | Same period last year, scaled by the growth trend | A year or more of history | Seasonal businesses |
| Funnel-based | Spend → clicks → leads → customers using stage rates | Stage rates by channel | Budget planning, paid channels |
| Statistical time series or regression | Models trend, seasonality and drivers | Long, clean history; analyst time | Large budgets, many channels |
Most teams combine a funnel forecast for paid with a seasonal forecast for organic.
A worked funnel-based forecast
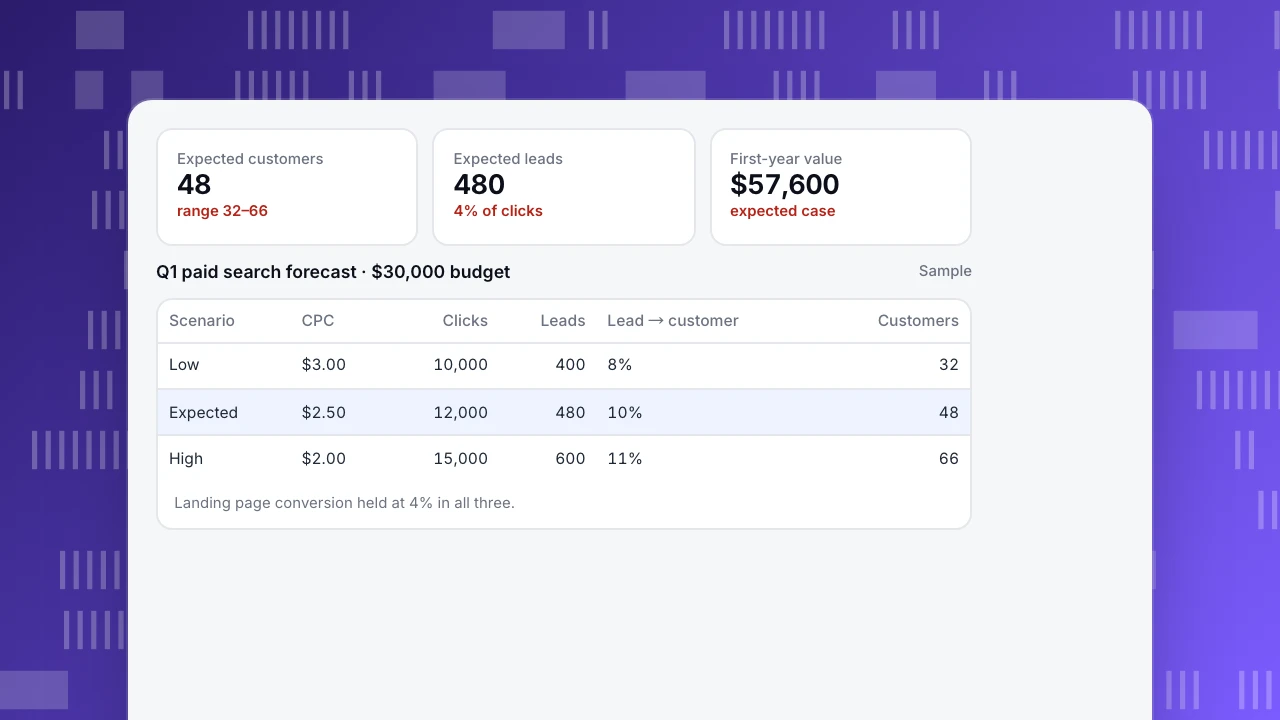
A B2B company plans Q1 paid search with a $30,000 budget. It uses its own last two quarters to set each rate (sample numbers):
Expected scenario:
- $30,000 ÷ $2.50 cost per click = 12,000 clicks
- 12,000 × 4% landing page conversion = 480 leads
- 480 × 10% lead-to-customer = 48 customers
- 48 × $1,200 first-year value = $57,600
Low and high scenarios change the two least certain rates:
- Low: CPC $3.00 → 10,000 clicks → 400 leads → 8% → 32 customers
- High: CPC $2.00 → 15,000 clicks → 600 leads → 11% → 66 customers
Add organic. Q1 last year brought 900 organic sign-ups; organic is growing about 15% a year, so about 1,035 sign-ups. At the historical 5% sign-up-to-customer rate, about 52 customers. Keep this separate from paid so each can be checked on its own.
Seasonality. If January is usually 20% below the quarter's average, split the quarterly forecast by month with that pattern, or the first month will look like a miss.
Expected customers
48
range 32–66
Expected leads
480
4% of clicks
First-year value
$57,600
expected case
Q1 paid search forecast · $30,000 budget
Sample| Scenario | CPC | Clicks | Leads | Lead → customer | Customers |
|---|---|---|---|---|---|
| Low | $3.00 | 10,000 | 400 | 8% | 32 |
| Expected | $2.50 | 12,000 | 480 | 10% | 48 |
| High | $2.00 | 15,000 | 600 | 11% | 66 |
Landing page conversion held at 4% in all three.
Compare forecast with actuals
Every month, put forecast and actual side by side for each stage, not just the final number:
- Clicks on track but leads low: a landing page problem.
- Leads on track but customers low: lead quality or sales follow-up.
- Everything low: budget, bids or seasonality.
Update the remaining months with what you learn. A forecast that is never revised is just a target.
Common mistakes
- One number instead of a range. It hides uncertainty and invites blame.
- Using industry benchmarks instead of your own rates.
- Mixing channels, so a strong channel hides a weak one.
- Ignoring lag. B2B leads may take 60 days to become customers; a Q1 forecast of customers depends partly on Q4 leads.
- Forgetting capacity. Doubling spend rarely doubles results; cost per click usually rises.
Inputs from TapCub
- Spend and cost per result: All-platform analytics › Business › Channel ROI imports daily cost by channel and campaign (CSV), and shows CPC (spend ÷ sessions), CPA (spend ÷ purchases) and ROAS by channel. Note that this CPC uses sessions, not platform clicks.
- Conversion rates: goals in Web analytics › Goals and funnels in All-platform analytics › Behavior › Behavior analysis give landing page and lead-to-customer rates from your own history.
- Traffic forecast: a monitor with a forecast band condition alerts when sessions or conversions fall outside the expected range, so you notice a miss within days.
Related: marketing ROI, marketing funnel and predictive analytics in marketing.
Was this article helpful?
We use your answers to fix and expand this page.
Couldn’t send. Please try again in a minute.
Thanks for the feedback. We’ll use it to improve this page.You’ve already sent feedback on this page. Thanks.

Growth Strategist
Explores acquisition channels, activation, and conversion experiments, turning data insights into actionable growth hypotheses and evaluation methods.