Try it on your own data
Every report in this article is in the free plan. One snippet for web and apps, up to 10 sites.
Start freePredictive analytics in marketing estimates what a person or segment will do next, so you can spend effort where it pays. You do not need a data science team to start: this guide covers five use cases, builds a simple lead score and checks it on held-out data, and explains how to judge whether a model works.
What you will learn
- Start with a simple rule-based score from a few behaviors; it often captures most of the value
- Always test on data the model did not see, and judge by lift and capture in the top groups
- Keep a small untouched group to measure the real effect of acting on the score
What it means in marketing
Predictive analytics uses what people did in the past to estimate what they are likely to do next. In marketing that usually means a score per person or account (how likely to buy, upgrade, churn, respond to an offer) or a forecast per segment or channel (how many sign-ups next month, how much revenue from a campaign).
It does not need machine learning to start. A rule-based score built from three behaviors, checked properly, often captures most of the value.
Five common use cases
The table below lists the use cases, the question each answers, the data it needs and a simple first version.
| Use case | Question | Data needed | Simple first version |
|---|---|---|---|
| Lead scoring | Which leads will buy? | Early product or site behavior, firmographics | Points for 3–5 key behaviors |
| Churn risk | Which customers may leave? | Usage trend, logins, support issues | Flag accounts with usage down 50% in 30 days |
| Customer lifetime value | How much will this customer be worth? | Order history, first purchase, channel | Average value by first product and channel |
| Next best offer | What should we offer this person? | Purchases, browsing categories | Most common next purchase after each product |
| Demand and budget forecast | How many sign-ups or sales next month? | Weekly history, seasonality, spend | Last year’s pattern scaled by this year’s trend |
Move to statistical or machine learning models only when the simple version is in use and you have enough outcomes.
A worked example: a simple lead score
A SaaS product had 2,000 trial sign-ups in a quarter; 240 became paying customers (12%). These are sample numbers.
Build the score (on the previous quarter). Look at behaviors in the first 3 days of a trial that paying customers did more often. Three stood out: installed the tracking code, created a dashboard, invited a teammate. Score = one point for each, with installing counted twice: 0–4 points.
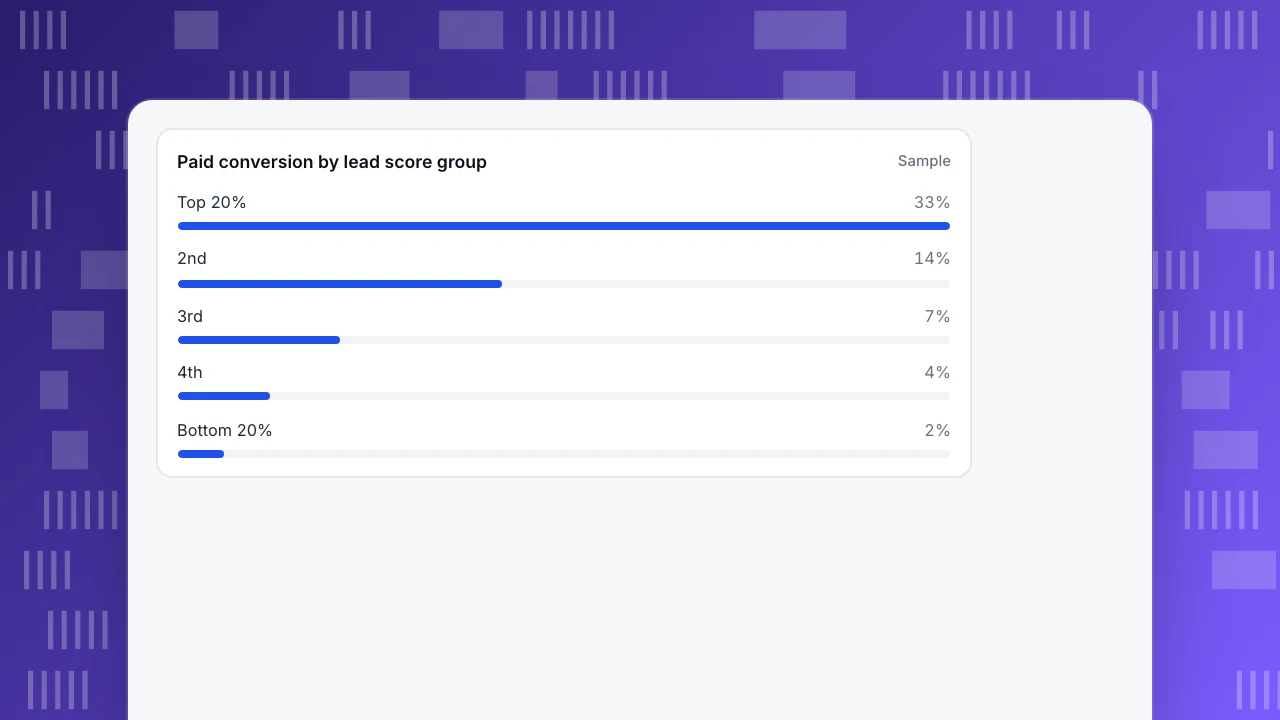
Check it on held-out data (this quarter). Score this quarter's 2,000 sign-ups without looking at who paid, sort them, split into five equal groups of 400, then compare with who actually paid:
| Score group | Leads | Became paid | Conversion |
|---|---|---|---|
| Top 20% | 400 | 132 | 33% |
| 2nd | 400 | 56 | 14% |
| 3rd | 400 | 28 | 7% |
| 4th | 400 | 16 | 4% |
| Bottom 20% | 400 | 8 | 2% |
| All | 2,000 | 240 | 12% |
- Lift of the top group: 33% ÷ 12% = 2.75×.
- Capture: the top 20% contains 132 of 240 customers, 55%.
Use it. Sales calls the top group within a day; the middle groups get onboarding emails focused on the missing step; the bottom group gets the standard sequence. Next quarter, compare conversion against the previous quarter, not only the score.
Paid conversion by lead score group
SampleHow to judge a model
- Always test on data the model did not see, such as a later period. A score built and tested on the same data always looks good.
- Lift and capture in the top groups matter more than overall accuracy. If 12% convert, a model that predicts "nobody converts" is 88% accurate and useless.
- Compare with a simple baseline. If a fancy model beats a three-rule score only slightly, keep the simple one.
- Watch for drift. Re-check every quarter; pricing, product and audience changes break old patterns.
Pitfalls
- Leakage: using information that only exists after the outcome, for example "visited the billing page", to predict payment.
- Self-fulfilling scores: if sales only calls high scores, high scores convert more partly because of the call. Keep a small random group untouched to measure the real effect.
- Correlation is not a lever: inviting a teammate predicts payment, but forcing invites may not cause it. See correlation vs causation.
- Too little data: with 30 conversions, any pattern is fragile. Start with forecasts at segment level instead.
What TapCub provides
TapCub does not train predictive models or produce scores. It gives you the inputs and the checks:
- Behavior per person: events such as "installed", "created dashboard", "invited teammate" in All-platform analytics › Users › People, linked to the account once you identify users.
- Groups to compare: All-platform analytics › Users › Segments & tags builds segments from behavior (recomputed daily), so you can compare conversion between "did all three in 3 days" and the rest.
- Conversion by group: funnels and goals filtered by segment show whether high-scoring groups really convert more.
- Traffic forecasts: monitors with a forecast band alert you when sessions or conversions move outside the expected range.
For churn-side scoring, see customer churn prediction. For lead funnels, see lead conversion rate.
Was this article helpful?
We use your answers to fix and expand this page.
Couldn’t send. Please try again in a minute.
Thanks for the feedback. We’ll use it to improve this page.You’ve already sent feedback on this page. Thanks.

Growth Strategist
Explores acquisition channels, activation, and conversion experiments, turning data insights into actionable growth hypotheses and evaluation methods.