Try it on your own data
Every report in this article is in the free plan. One snippet for web and apps, up to 10 sites.
Start freeProduct discovery decides what is worth building before you spend a quarter building it. This guide covers the four risks discovery tests, the methods for each, and a worked case where usage data, interviews, replays and a fake-door test lead to one clear decision.
What you will learn
- Discovery reduces four risks before building: value, usability, feasibility and viability
- Use data to find where and how big a problem is, and interviews to learn why
- Test the riskiest assumption first, with the cheapest method that can answer it
What is product discovery?
Product discovery is the work a product team does to find out which problems are worth solving and which solutions will work, before committing engineering time to build them. Its output is not a feature; it is evidence strong enough to decide.
It sits next to delivery, the work of building and shipping. Teams that only deliver ship features nobody uses; teams that only discover never ship. Most good teams do both every week.
The four risks discovery tests
Every idea carries four risks. Discovery tries to reduce them cheaply:
- Value: will customers want it, or buy it?
- Usability: can they figure out how to use it?
- Feasibility: can we build it with the time, skills and technology we have?
- Viability: does it work for the business: pricing, legal, support, sales?
Methods and what they answer
The table below matches common methods to the risks they test and what they cost. Mix numbers and conversations: data shows where and how much, interviews show why. See qualitative vs quantitative data.
| Method | Risk it tests | Typical cost | Answers |
|---|---|---|---|
| Funnel and usage data | Value (where) | Hours | Where people stop, how many |
| Customer interviews | Value (why) | Days | What they tried, what they need |
| Session replays | Usability | Hours | What people actually do on a step |
| Fake-door test | Value (demand) | Days | Whether people click for it |
| Prototype test | Usability | Days | Whether people can complete the task |
| Technical spike | Feasibility | Days | Whether it can be built, and how |
| Stakeholder review | Viability | Hours | Pricing, legal, support or sales blockers |
Pair one number-based method with one conversation-based method for every major question.
A worked case: from data to decision
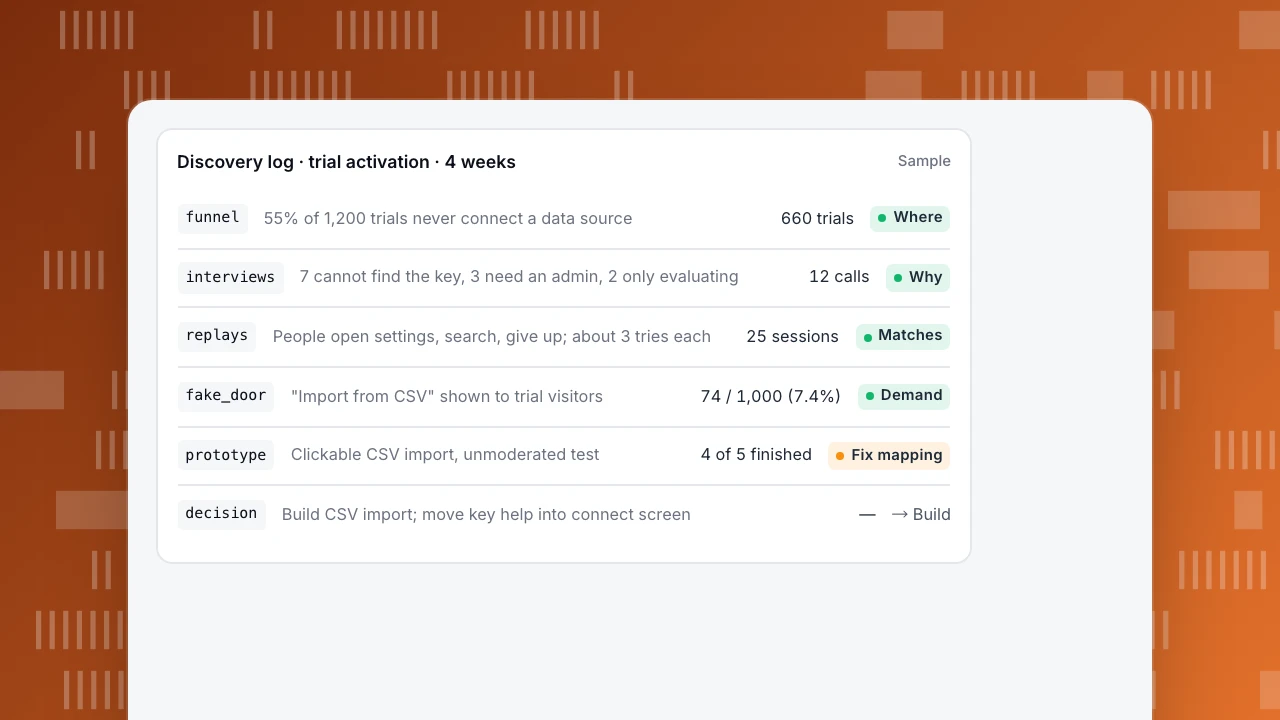
A B2B analytics product sees weak trial conversion. The team runs four weeks of discovery (sample numbers):
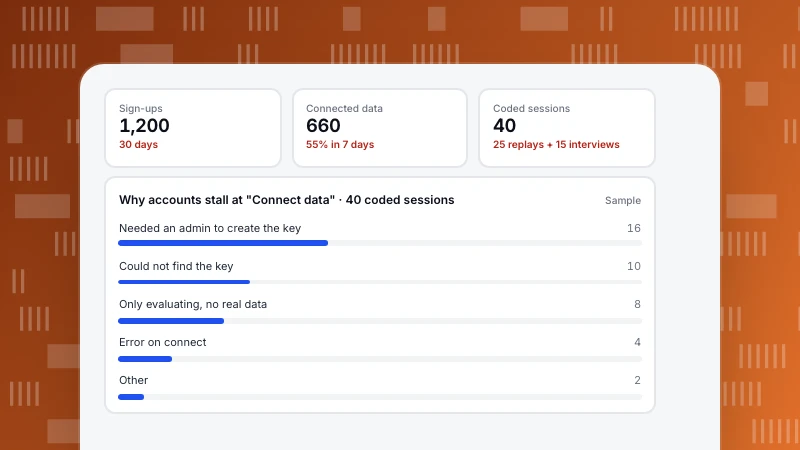
- Data shows where. Of 1,200 trials in a month, 55% never connect a data source, the step before any value appears. The funnel points at one step, not the whole product.
- Interviews show why. Twelve calls with trial users who stalled: seven could not find the API key, three needed an admin to create one, two were only evaluating.
- Replays confirm it. Twenty-five recordings of the connect step show people opening settings, searching and giving up, an average of three tries each.
- A fake door tests demand. An "Import from CSV" button is shown to 1,000 trial visitors; 74 click it (7.4%) and see a "coming soon, want early access?" message.
- A prototype tests usability. Five users try a clickable CSV import; four finish without help, one stumbles on column mapping.
Decision: build CSV import with clearer column mapping, and move the API key instructions into the connect screen itself. Each step cost days, not a quarter.
Discovery log · trial activation · 4 weeks
Samplefunnel55% of 1,200 trials never connect a data source660 trialsWhereinterviews7 cannot find the key, 3 need an admin, 2 only evaluating12 callsWhyreplaysPeople open settings, search, give up; about 3 tries each25 sessionsMatchesfake_door"Import from CSV" shown to trial visitors74 / 1,000 (7.4%)DemandprototypeClickable CSV import, unmoderated test4 of 5 finishedFix mappingdecisionBuild CSV import; move key help into connect screen—→ Build
Keeping it continuous
- Talk to customers every week. One or two short interviews keep assumptions honest.
- Review the numbers every week. One funnel, one retention view, a few replays.
- Keep an opportunity list. Problems with evidence and size, not a feature wishlist.
- Test assumptions, not ideas. Write down what must be true for an idea to work, and test the riskiest one first.
Common mistakes
- Asking customers what to build. Ask about what they did last time, not what they would like.
- Treating discovery as a phase. A one-off research project goes stale fast.
- Only qualitative or only quantitative. Twelve interviews cannot size a problem; a funnel cannot explain it.
- Fake doors without honesty. Tell people the feature is coming and offer something in return.
- Confusing an MVP with a discovery test. An MVP is a shipped product; most discovery tests are much smaller.
The quantitative side in TapCub
Build a funnel from your own events in All-platform analytics to find the step where people stop. Watch session replays of that step to see what they try. Track a fake-door button as an event and compare click rates by segment or plan. After launch, check whether the new path raises activation, the point where users first see value. See also product usage analytics.
See also
See also: What is an opportunity solution tree? Levels, example and mistakes.
Was this article helpful?
We use your answers to fix and expand this page.
Couldn’t send. Please try again in a minute.
Thanks for the feedback. We’ll use it to improve this page.You’ve already sent feedback on this page. Thanks.

Product Adoption Consultant
Explores customer onboarding, live conversations, and self-service, turning common usage questions into practical guidance and improvements.