Try it on your own data
Every report in this article is in the free plan. One snippet for web and apps, up to 10 sites.
Start freeProduct validation is collecting evidence that an idea is worth building before most of the cost is spent. This guide covers the four things to validate, methods ordered by cost, and a worked example of a fake-door test followed by a concierge test, with pass thresholds written down before either started.
What you will learn
- Validate problem, demand, solution and value in that order; each step is cheaper than the next
- Measure what people do (clicks, sign-ups, repeat use), not what they say they would do
- Write the pass threshold before the test, and check retention weeks later, not just early interest
What product validation is
Product validation is gathering evidence that something is worth building before building most of it. It answers four questions, in order:
- Problem: do enough people have this problem, often enough, to care?
- Demand: will they take an action to get a solution: click, sign up, pay, give time?
- Solution: does your approach actually solve it in a way they can use?
- Value: do they keep using it after the novelty wears off?
Each step is cheaper than the next. A "no" early saves the cost of everything after it.
Validation methods by cost
The table below lists common methods, what each validates, rough cost and the signal to look for.
| Method | Validates | Cost | Signal to look for |
|---|---|---|---|
| Customer interviews | Problem | Low | Specific recent stories, existing workarounds |
| Search and community research | Problem, demand | Low | People asking for it in their own words |
| Landing page or waitlist | Demand | Low | Sign-up rate from targeted traffic |
| Fake door in the product | Demand | Low to medium | Click rate among the right users |
| Concierge or manual service | Solution, value | Medium | Repeat use over several weeks |
| Prototype usability test | Solution | Medium | Tasks completed without help |
| Pre-orders or paid pilot | Demand, value | Medium to high | Money paid, renewals |
| Minimum viable product | Value | High | Retention after launch |
Move to the next row only when the current one passes its threshold.
A worked example: scheduled reports
A team wants to build "scheduled reports": email a saved report every Monday. Interviews suggested people copy numbers into emails by hand. Before building, they set thresholds (sample numbers throughout):
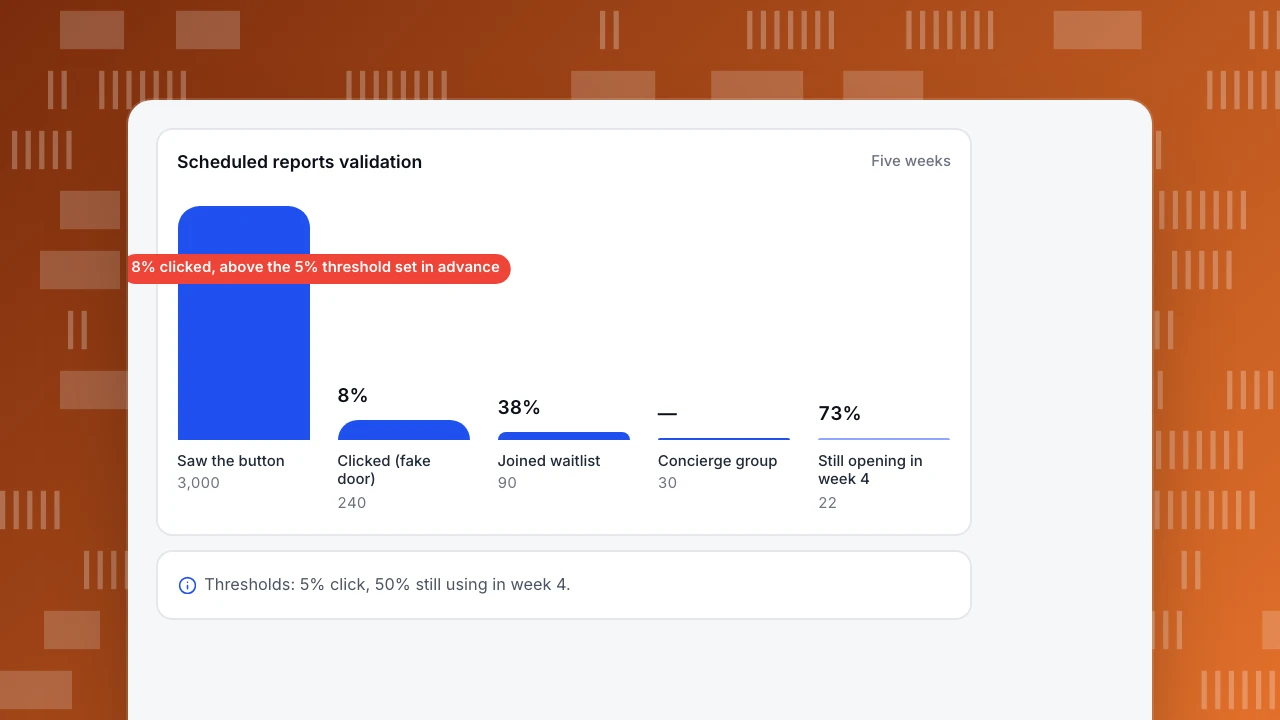
- Fake door: at least 5% of accounts that see the button click it.
- Concierge: at least 50% of the manual group still open the emails in week 4.
Step 1, fake door (one week). A "Schedule this report" button appears on report pages for 3,000 weekly active accounts. Clicking shows: "Scheduled reports are coming. Want early access?"
- 240 accounts clicked (8%), above the 5% threshold
- 90 joined the waitlist
- 12 short interviews: 10 described a weekly manual routine
Step 2, concierge (four weeks). For 30 waitlist accounts, a team member sends the report by hand every Monday. Week 4: 22 of 30 (73%) still open it, above the 50% threshold. Five asked for a second recipient, which goes into the first version.
Decision: build a minimal version (weekly, one report, up to three recipients), then check weekly retention of the feature after launch.
Scheduled reports validation
Five weeksSaw the button
3,000
Clicked (fake door)
240
Joined waitlist
90
Concierge group
30
Still opening in week 4
22
Running fake doors honestly
- Say clearly that the feature is not available yet; never take payment for something that does not exist.
- Show it to a limited share of users, for a limited time.
- Follow up with everyone on the waitlist, whatever you decide.
Common mistakes
- Asking instead of observing. "Would you use this?" gets polite yeses. Clicks, sign-ups and repeat use are evidence.
- No threshold in advance. Without one, any result can be read as success.
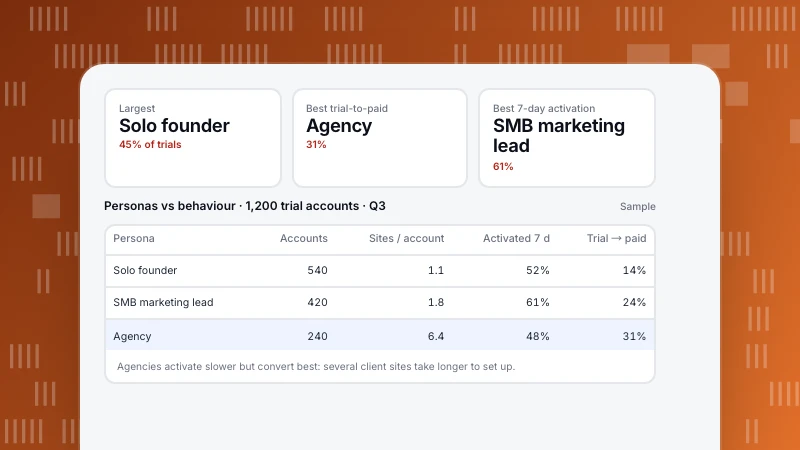
- Validating with the wrong people. Test with the segment you are building for; see user persona.
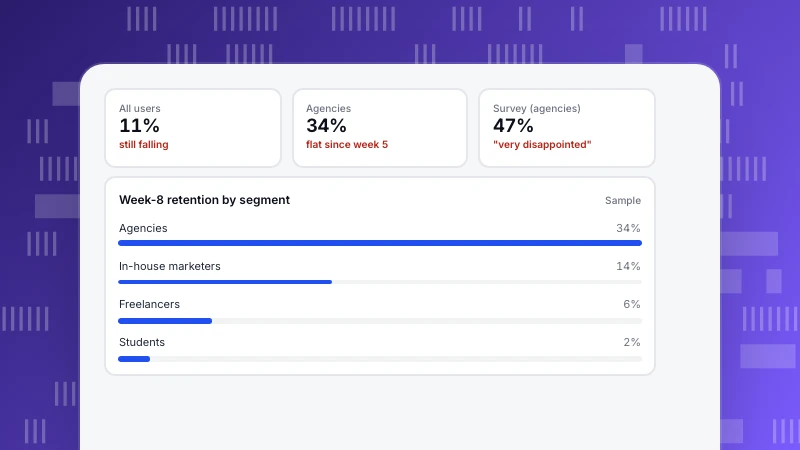
- Skipping the value step. Early excitement fades; retention after a few weeks is the real test. See product-market fit metrics.
Measuring it in TapCub
- Fake door clicks: send an event such as "schedule_report_click" with the report type as a property; count unique accounts in All-platform analytics › Behavior › Behavior analysis and divide by accounts that viewed report pages.
- Waitlist: a goal on the waitlist form submission in Web analytics › Goals, or an event in the product.
- Value after launch: the retention model in the same Behavior analysis page, with "used scheduled report" as the start and return event, shows whether accounts keep using it week after week.
- Who: compare segments in All-platform analytics › Users › Segments & tags to see whether the target persona responds more than others.
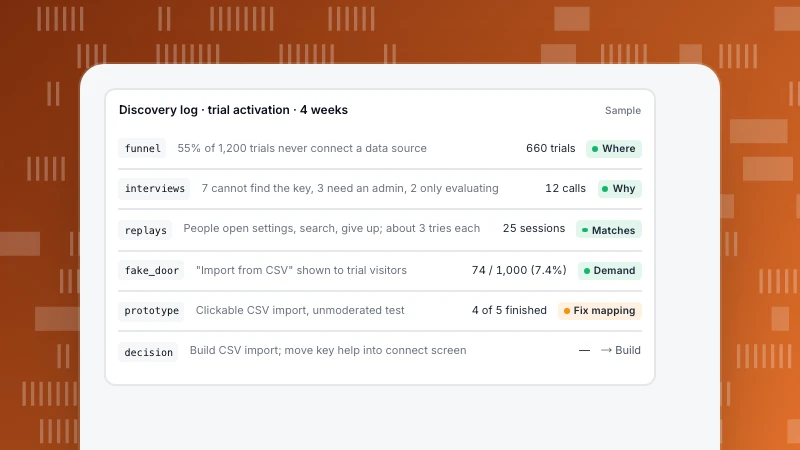
For the earlier step of choosing what to test, see product discovery and the glossary entry on the minimum viable product.
See also: Dogfooding.
See also: Product hypothesis.
See also: What is a painted door test? How to run a fake door test.
Was this article helpful?
We use your answers to fix and expand this page.
Couldn’t send. Please try again in a minute.
Thanks for the feedback. We’ll use it to improve this page.You’ve already sent feedback on this page. Thanks.

Product Adoption Consultant
Explores customer onboarding, live conversations, and self-service, turning common usage questions into practical guidance and improvements.