Try it on your own data
Every report in this article is in the free plan. One snippet for web and apps, up to 10 sites.
Start freeProduct usage analytics measures what people actually do inside your product: which features they use, how often and how much. It tells product teams what to build next and customer success teams which accounts need help. This guide gives five usage metrics with formulas, shows how account-level usage differs from user-level, and walks through a sample that led to a decision.
What you will learn
- Track five things: active users, frequency, stickiness, feature adoption and depth
- For B2B products, look at accounts as well as users
- Tie usage to outcomes: which usage patterns predict retention or upgrade
What product usage analytics is
Product usage analytics is the measurement of how people use a product after they sign up. It answers:
- Which features are used, and by how many people?
- How often do people come back?
- Which usage patterns go with staying, upgrading or leaving?
It is built on event data: each meaningful action in the product is tracked as an event. See event tracking.
Five usage metrics
The table lists five metrics and their formulas. Two notes:
- Define "active" with a qualifying event, such as creating or viewing a report, not just logging in.
- Stickiness can be read two ways: daily active divided by monthly active, or the share of people active on several days a week. In TapCub, the lifecycle view's stickiness shows how many people were active on N days in each week or month, with the share.
| Metric | Formula | Answers |
|---|---|---|
| Active users | Distinct users with any qualifying event in the period | How many people use it |
| Frequency | Active days per user per period | How often they come back |
| Stickiness | Daily active ÷ monthly active, or share active on N+ days a week | How much it is part of their routine |
| Feature adoption | Users of feature ÷ active users | How widely a feature is used |
| Depth | Events per active user for a feature | How heavily it is used |
Choose a qualifying event for "active", not just a login.
Users and accounts
In B2B products, a customer is an account with many users. Usage can look healthy by user count and still be weak by account: ten busy users in one account and one inactive user in each of thirty others. Look at:
- Active accounts and active users per account.
- Accounts where the main user stopped. These are at risk even if a few others are active.
A worked example
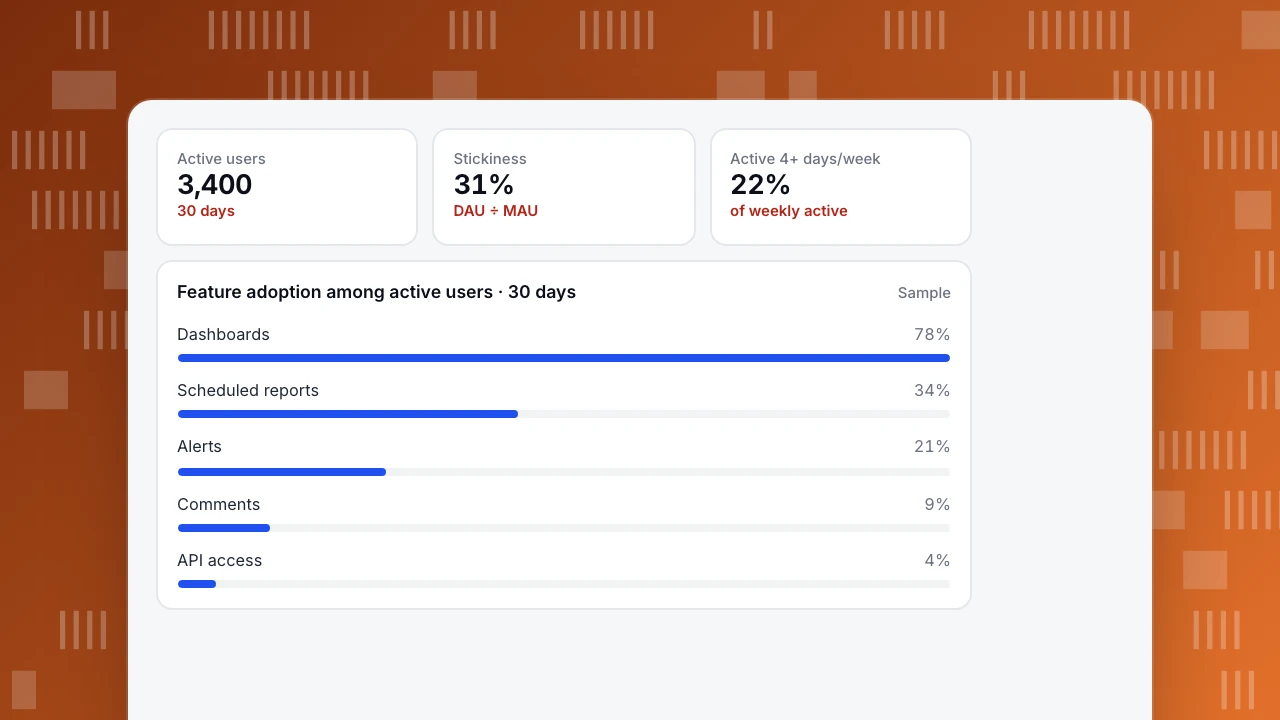
A reporting tool looks at feature adoption among 3,400 active users. Dashboards are used by 78%, scheduled reports by 34% and comments by only 9%.
The team was about to remove comments. Before deciding, they compared renewals: accounts where someone used comments renewed more often than accounts that did not. Comments were a sign of a team using the product together. Instead of removing the feature, the team made it easier to find and added mentions.
Correlation is not proof that comments cause renewal; see correlation vs causation. But it was enough to keep the feature and test whether more use leads to better renewal.
Active users
3,400
30 days
Stickiness
31%
DAU ÷ MAU
Active 4+ days/week
22%
of weekly active
Feature adoption among active users · 30 days
SampleA monthly routine
- Check active users, frequency and stickiness against last month.
- Review adoption for features launched in the last quarter. See how to measure product adoption.
- List accounts whose usage fell by half or more and share them with customer success.
- Pick one usage pattern and check whether it goes with retention.
FAQ
What is product usage data?
Records of what people do inside a product: which features they open, which actions they take and when.
How do I measure feature usage?
Track the feature's key action as an event, then measure adoption (users of the feature ÷ active users) and depth (events per user).
What is a good stickiness ratio?
It depends on how often the product should be used. A daily tool aims high; a weekly reporting tool will be lower and still be healthy.
See also: Product analytics examples, Product analytics framework.
Was this article helpful?
We use your answers to fix and expand this page.
Couldn’t send. Please try again in a minute.
Thanks for the feedback. We’ll use it to improve this page.You’ve already sent feedback on this page. Thanks.

Product Adoption Consultant
Explores customer onboarding, live conversations, and self-service, turning common usage questions into practical guidance and improvements.