Try it on your own data
Every report in this article is in the free plan. One snippet for web and apps, up to 10 sites.
Start freeAnalytics reports are full of "people who do X do better". This guide explains the difference between correlation and causation, walks through a sample where traffic source creates most of a "video doubles sign-ups" claim, and lists the checks and tests that tell you whether to act.
What you will learn
- A correlation is a lead, not a decision: check for confounders, reverse causation and chance
- Split the gap by source, device or plan; if it shrinks, the people differed, not the action
- Use an A/B test, a holdout or a controlled before/after to get to cause
The difference in one sentence
Correlation means two things move together: when one goes up, the other tends to go up (or down). Causation means one of them makes the other happen: change the first and the second changes because of it.
Every causal link produces a correlation, but most correlations are not causal links. In analytics this matters because reports are full of correlations. "Users who invite a teammate retain twice as well." "Visitors who open chat convert more." "Pages with videos have lower bounce rates." Each one might be a cause you can act on, or it might be a side effect of who those users are.
Why dashboards are full of false causes
Three things produce a correlation without a cause:
- A confounder. A third factor drives both numbers. High-intent visitors both watch the demo video and buy; the video did not make them buy.
- Reverse causation. The arrow points the other way. Customers who are already succeeding use more features; using features did not make them succeed.
- Chance. Look at enough segments and some will differ by luck. With 20 segments, one will usually look "significant" at the 5% level even if nothing is going on.
The trap is the same each time: the people who did X are different from the people who did not, before X ever happened. Analytics data is observational, so people choose what they do, and that choice carries their intent, their source and their history.
A worked example: does the demo video cause sign-ups?
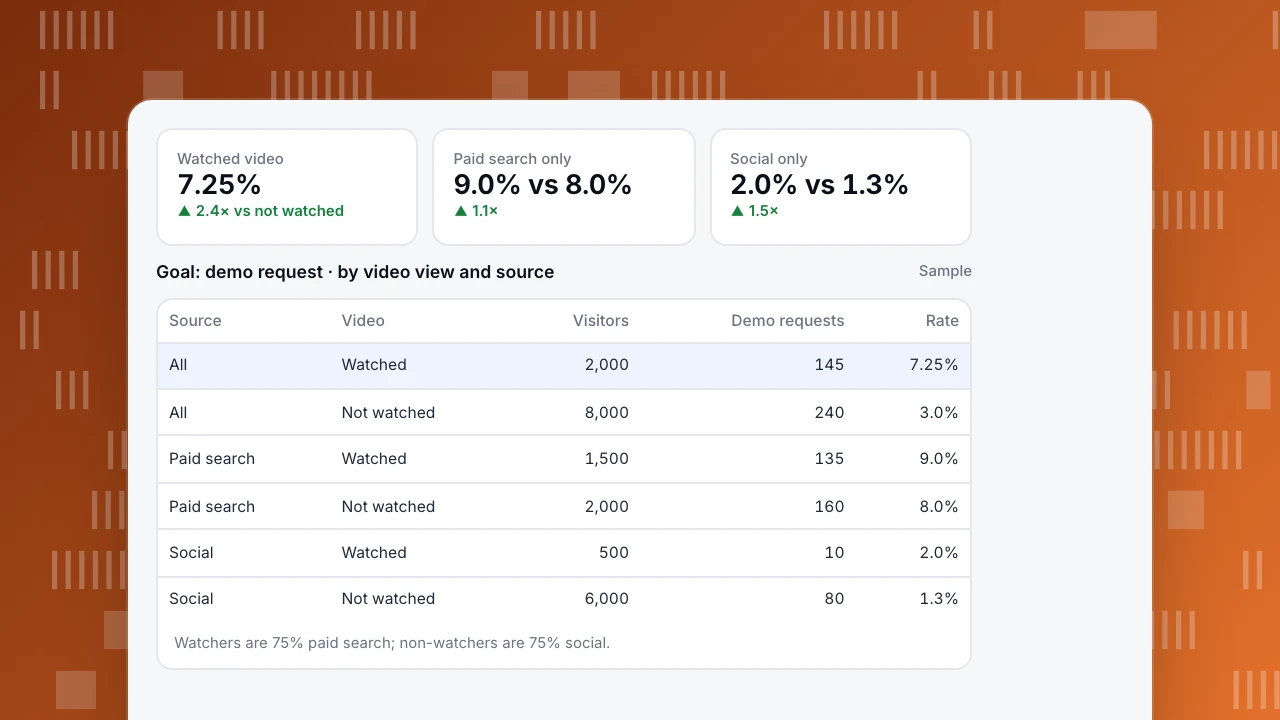
A SaaS site has a two-minute demo video on its pricing page. In 30 days, 10,000 visitors arrive; 2,000 watch the video. The goal report shows that 7.25% of watchers requested a demo, against 3.0% of everyone else. That looks like the video multiplies conversion by 2.4. The obvious move is to put the video on every page.
Now split the same visitors by traffic source. Paid search visitors (people searching for the product category) are far more likely to both watch the video and convert. They make up 75% of watchers but only 25% of non-watchers. Within paid search, watchers convert at 9.0% and non-watchers at 8.0%. Within social, 2.0% against 1.3%.
The video still seems to help a little, but most of the 2.4× gap came from who watched it. This pattern, where a gap shrinks or reverses once you split by a third factor, is called Simpson's paradox. The split does not prove the remaining gap is causal either; it just removes one confounder you could see.
Watched video
7.25%
▲ 2.4× vs not watched
Paid search only
9.0% vs 8.0%
▲ 1.1×
Social only
2.0% vs 1.3%
▲ 1.5×
Goal: demo request · by video view and source
Sample| Source | Video | Visitors | Demo requests | Rate |
|---|---|---|---|---|
| All | Watched | 2,000 | 145 | 7.25% |
| All | Not watched | 8,000 | 240 | 3.0% |
| Paid search | Watched | 1,500 | 135 | 9.0% |
| Paid search | Not watched | 2,000 | 160 | 8.0% |
| Social | Watched | 500 | 10 | 2.0% |
| Social | Not watched | 6,000 | 80 | 1.3% |
Watchers are 75% paid search; non-watchers are 75% social.
Four checks before you call it causal
Run these on any "people who do X do better" claim before you spend money on it. The table lists the question and how to check it with ordinary reports.
| Check | Question to ask | How to check it in reports |
|---|---|---|
| Confounder | Is there a third factor that drives both? | Split the gap by source, device, plan, country. Does it survive inside each group? |
| Reverse causation | Could the outcome cause the action? | Look at time order: did the action come before the outcome for most users? |
| Chance | Is the gap bigger than noise? | Check the sample size and a significance test; be wary if you scanned many segments |
| Selection | Did people choose to do X? | If yes, they differ from those who did not. Compare like with like, or test |
Pass all four and you have a strong hypothesis. Only a controlled test proves cause.
How to actually test for cause
When the decision is worth it, design the comparison instead of reading it off a report:
- A/B test. Randomly show the video to half of the visitors. Randomisation spreads intent, source and history evenly across both groups, so a difference in the goal rate is caused by the video (within the margin of error). See how to calculate statistical significance.
- Holdout. For things you cannot split per visit (an email series, a loyalty scheme), keep a random 5–10% of eligible users out and compare.
- Before and after, with a control. When you change a whole page, compare the change on that page with the change on similar pages you did not touch over the same weeks. A plain before/after picks up seasonality and campaigns. Add an annotation on the day you shipped so the comparison is easy to find later.
- Matched comparison. If none of the above is possible, compare users who did X with users who did not within the same source, device, plan and signup week. It is weaker than a test, but far better than the raw gap.
Doing the split in TapCub
The goals report breaks every goal down by source, entry page, country and device, so the first check (does the gap survive within each source?) takes one click. For behaviour-based groups such as "watched the video", send a custom event, build a segment from it and compare the segment's goal rate with the rest of the site under the same filters. Read the result as a hypothesis to test, not as the answer. Our guide to customer segmentation analysis covers how to choose the splits.
FAQ
Does correlation ever prove causation?
Not on its own. A strong, consistent correlation that survives splits by the obvious confounders, has the right time order and has a plausible mechanism is good evidence, but a randomised test is what settles it.
What is a confounding variable in marketing data?
A factor that affects both the action and the outcome. Traffic source, device, plan, customer size and signup date are the usual ones. If a gap disappears when you compare within one value of the factor, that factor was confounding it.
What is a spurious correlation?
A correlation with no causal path at all, usually from chance or from two numbers that both grow over time. Two metrics that both rose in a growing quarter will correlate strongly whether or not they are related.
How large does a sample need to be to trust a difference?
It depends on the base rate and the size of the difference. A 1-point difference on a 3% conversion rate needs tens of thousands of visitors per group; a 10-point difference needs far fewer. Calculate it before you start a test, not after.
Was this article helpful?
We use your answers to fix and expand this page.
Couldn’t send. Please try again in a minute.
Thanks for the feedback. We’ll use it to improve this page.You’ve already sent feedback on this page. Thanks.

Product Analyst
Focuses on event analysis, conversion funnels, and retention, using clear metric definitions and structured analysis to explain product performance.