Try it on your own data
Every report in this article is in the free plan. One snippet for web and apps, up to 10 sites.
Start freeStatistical significance tells you whether a gap between two conversion rates is larger than chance would usually produce. This guide gives the five steps of the two-proportion test, works an example by hand and in code where a 15% lift is significant only at the larger sample, and shows how to size a test.
What you will learn
- Significance asks how surprising the gap would be if there were no real difference
- Use the two-proportion z-test: rates, pooled rate, standard error, z, p-value
- Calculate the sample size first; the same lift can be significant or not
What statistical significance means
You ran an A/B test: version A converted 3.0% of visitors, version B 3.45%. B looks better, but any two groups of visitors would convert at slightly different rates even if the pages were identical. Statistical significance is a way of asking: if there were really no difference, how surprising would a gap this large be?
That surprise is measured by the p-value: the probability of seeing a difference at least this large if the two versions truly performed the same. If the p-value is below a threshold you set in advance, the significance level or alpha (usually 0.05), you call the result statistically significant.
Significant does not mean large or important, and not significant does not mean "no effect". It means the data are, or are not, strong enough to rule out chance at the level you chose. The two ways that can go wrong are covered in type 1 vs type 2 errors.
The five steps for conversion rates
For two conversion rates, the standard method is the two-proportion z-test:
- Compute each rate. pA = conversions A ÷ visitors A; pB = conversions B ÷ visitors B.
- Compute the pooled rate under the assumption of no difference: p = (conversions A + conversions B) ÷ (visitors A + visitors B).
- Compute the standard error of the difference: SE = √[ p × (1 − p) × (1/nA + 1/nB) ].
- Compute the z-score: z = (pB − pA) ÷ SE. It says how many standard errors apart the two rates are.
- Turn z into a p-value. For a two-sided test, p = 2 × (1 − Φ(|z|)), where Φ is the standard normal distribution. At alpha = 0.05, |z| above 1.96 is significant.
The normal approximation works when each group has at least a few dozen conversions and non-conversions, which almost every website test does.
A worked example
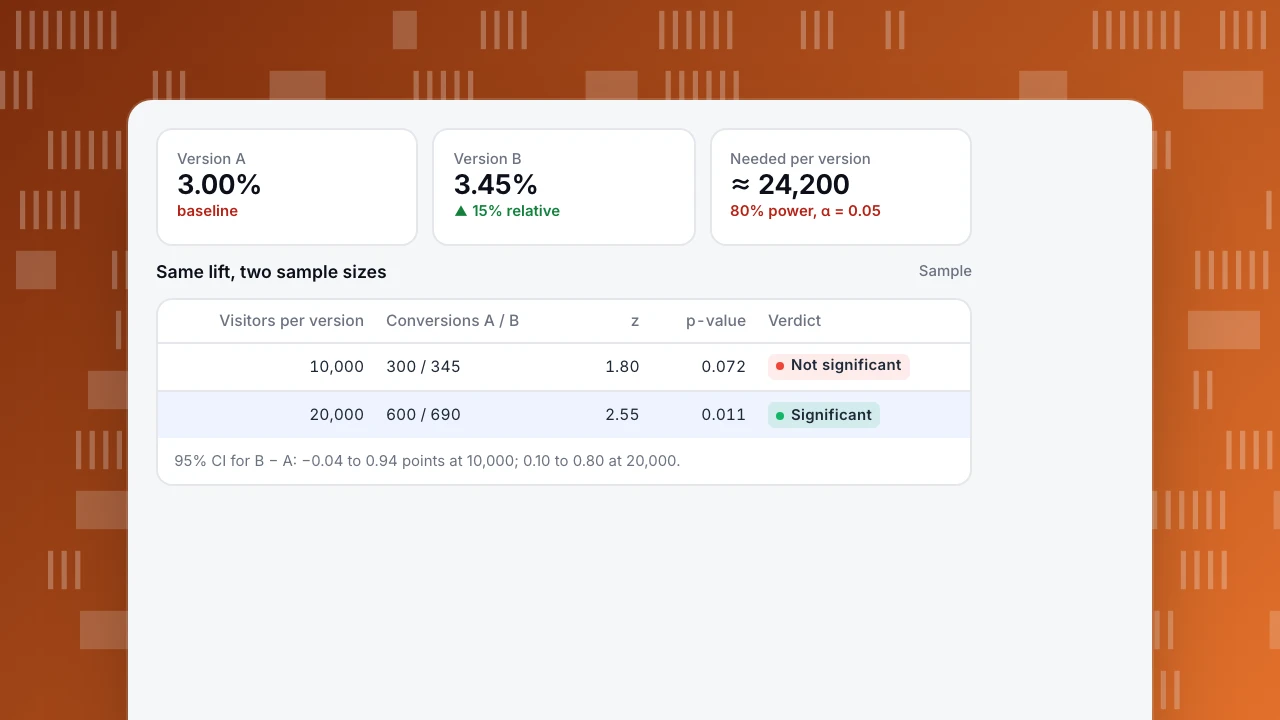
Test 1: 10,000 visitors per version. A: 300 conversions (3.00%). B: 345 conversions (3.45%), a 15% relative lift.
- Pooled rate: 645 ÷ 20,000 = 0.03225.
- SE = √(0.03225 × 0.96775 × 0.0002) = 0.00250.
- z = 0.0045 ÷ 0.00250 = 1.80; p = 0.072.
That is above 0.05, so the result is not significant. The 95% confidence interval for the difference runs from −0.04 to +0.94 percentage points: the data are compatible with B being slightly worse, or almost a point better.
Test 2: the same rates with 20,000 visitors per version (600 vs 690 conversions). The standard error shrinks to 0.00177, z rises to 2.55 and p falls to 0.011: significant. The confidence interval narrows to +0.10 to +0.80 points.
Same lift, different verdict. Sample size, not the size of the lift alone, decides whether a test can tell a real effect from noise.
Version A
3.00%
baseline
Version B
3.45%
▲ 15% relative
Needed per version
≈ 24,200
80% power, α = 0.05
Same lift, two sample sizes
Sample| Visitors per version | Conversions A / B | z | p-value | Verdict |
|---|---|---|---|---|
| 10,000 | 300 / 345 | 1.80 | 0.072 | Not significant |
| 20,000 | 600 / 690 | 2.55 | 0.011 | Significant |
95% CI for B − A: −0.04 to 0.94 points at 10,000; 0.10 to 0.80 at 20,000.
Calculate it in code
The function below runs the five steps and returns the z-score and the two-sided p-value. It uses a standard polynomial approximation for the normal distribution, accurate to about four decimal places, which is plenty for test decisions. In a spreadsheet, the same p-value is \=2*(1-NORM.S.DIST(ABS(z),TRUE))\.
// Two-proportion z-test for conversion rates
function twoProportionTest(convA, nA, convB, nB) {
  const pA = convA / nA, pB = convB / nB;
  const p = (convA + convB) / (nA + nB);           // rate if A and B were the same
  const se = Math.sqrt(p * (1 - p) * (1 / nA + 1 / nB));
  const z = (pB - pA) / se;
  const pValue = 2 * (1 - normalCdf(Math.abs(z))); // two-sided p-value
  return { pA, pB, z, pValue };
}

// Standard normal CDF (Abramowitz–Stegun approximation)
function normalCdf(x) {
  const t = 1 / (1 + 0.2316419 * x);
  const d = 0.3989423 * Math.exp(-x * x / 2);
  const q = d * t * (0.3193815 + t * (-0.3565638 + t * (1.781478 + t * (-1.821256 + t * 1.330274))));
  return 1 - q;
}

twoProportionTest(300, 10000, 345, 10000); // z ≈ 1.80, p ≈ 0.072
twoProportionTest(600, 20000, 690, 20000); // z ≈ 2.55, p ≈ 0.011
Size the test before you start
The number of visitors each version needs depends on the baseline rate, the smallest lift worth detecting, alpha and power (usually 80%):
n per version ≈ (1.96 + 0.84)² × [p1(1 − p1) + p2(1 − p2)] ÷ (p2 − p1)²
For a baseline of 3.0% and a target of 3.45%, that is about 24,200 visitors per version. Test 1 above, with 10,000, never had a good chance of reaching significance; Test 2, with 20,000, was close to the planned size. Calculate this before launching, and do not stop early when the result first looks significant: checking repeatedly and stopping at the first good reading inflates false positives.
Clean inputs matter as much as the formula. Bots, internal visits and duplicate conversions add noise to both groups and make real effects harder to detect.
FAQ
What p-value is statistically significant?
By convention, below 0.05 (a 5% significance level). Some teams use 0.01 for costly decisions or 0.10 for cheap, reversible ones. Choose before the test.
Is 90% confidence good enough?
It means accepting a 10% false-positive rate on tests with no real effect. For low-risk changes you can reverse quickly, many teams accept that; for pricing or major redesigns, use 95% or stricter.
What if my test is not significant?
It means the data cannot rule out chance, not that the versions are equal. Look at the confidence interval: if it excludes any lift worth having, stop; if it is wide, the test was too small.
Can I use a significance calculator instead?
Yes. Calculators run the same test. Knowing the steps helps you check inputs (visitors, not sessions, if you randomised by visitor) and read the interval, not only the verdict.
Related: type I vs type II errors and p-value.
See also: Central limit theorem, Experimenter bias.
See also: What is a multi-armed bandit? Algorithms, examples and vs A/B testing.
Was this article helpful?
We use your answers to fix and expand this page.
Couldn’t send. Please try again in a minute.
Thanks for the feedback. We’ll use it to improve this page.You’ve already sent feedback on this page. Thanks.

Product Analyst
Focuses on event analysis, conversion funnels, and retention, using clear metric definitions and structured analysis to explain product performance.