Try it on your own data
Every report in this article is in the free plan. One snippet for web and apps, up to 10 sites.
Start freeA type 1 error is calling a winner that is not real; a type 2 error is missing an effect that is. This guide explains both with the 2×2 table, works through 100 A/B tests to show how many winners are false at high and low power, and lists the habits that keep both errors low.
What you will learn
- Type 1 = false positive (alpha, usually 5%); type 2 = false negative (beta; power = 1 − beta)
- Low power raises the share of false winners, not just the number of missed ones
- Size tests in advance, do not stop early, and pick one primary metric
The two errors in one sentence each
When you run an A/B test, you are deciding between two statements: "the change made no difference" (the null hypothesis) and "the change made a difference". You can be wrong in two ways.
- A type 1 error (type I, a false positive) is concluding the change worked when it did not. You ship a "winner" that is really noise.
- A type 2 error (type II, a false negative) is concluding the change did nothing when it actually helped. You throw away a real improvement.
Each error has a rate you choose before the test. The type 1 rate is called alpha (α), usually 5%. The type 2 rate is called beta (β), and its complement, 1 − β, is the test's power, usually set at 80%.
The 2×2 table
Every test ends in one of four boxes, depending on what is true and what you concluded. Two boxes are correct decisions, two are the errors.
The table also shows the trade-off. Make it harder to declare a winner (a lower alpha) and you will have fewer false positives but more false negatives, unless you also collect more data.
| No real effect (null true) | Real effect (null false) | |
|---|---|---|
| You declare a winner | Type 1 error: false positive (rate = α) | Correct: true positive (rate = power) |
| You declare no difference | Correct: true negative (rate = 1 − α) | Type 2 error: false negative (rate = β) |
Alpha and power are chosen before the test; sample size connects them.
A worked example: how many of your winners are real?
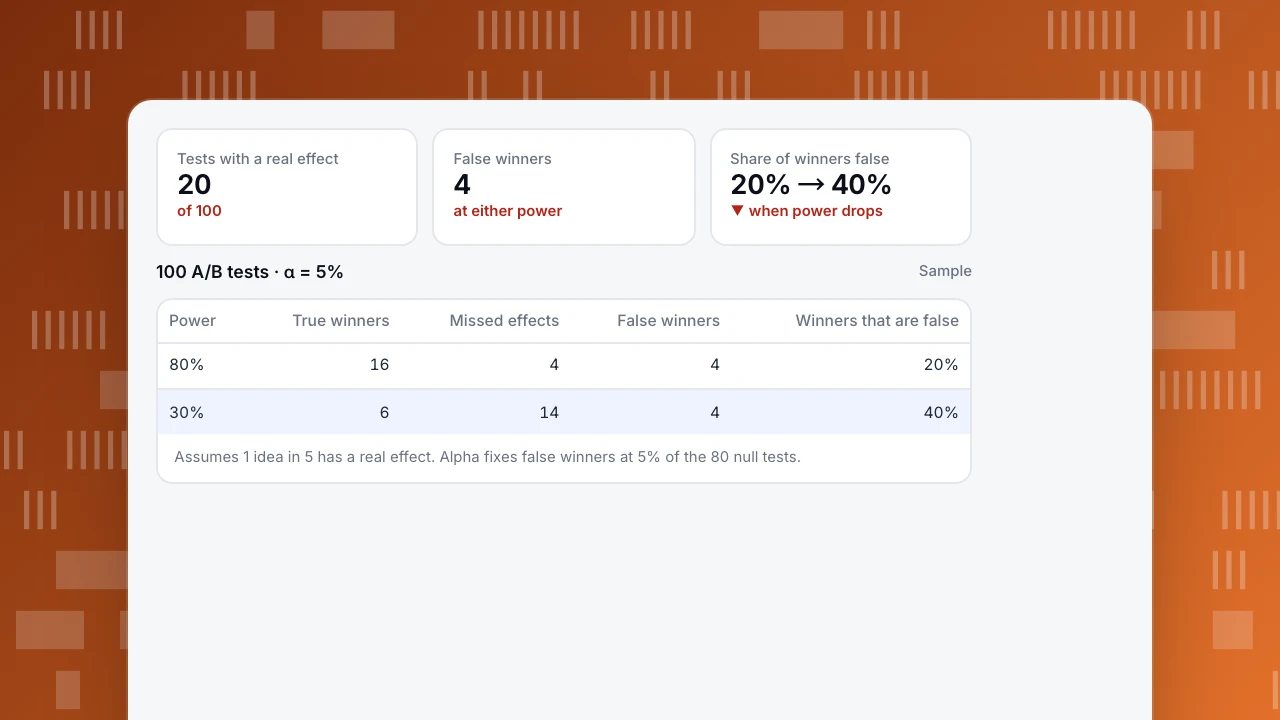
Suppose a team runs 100 A/B tests in a year. From experience, about one idea in five really moves the metric, so 20 tests have a real effect and 80 do not. They test at α = 5%.
With 80% power (the sample size was calculated for the effect they expected):
- Of the 80 tests with no real effect, 5% come out "significant" by chance: 4 false winners (type 1 errors).
- Of the 20 tests with a real effect, 80% are detected: 16 true winners; 4 real effects are missed (type 2 errors).
- So 20 winners are declared, and 4 of them, 20%, are false.
With 30% power (tests stopped early or run on too little traffic):
- Still 4 false winners from the 80 null tests; alpha has not changed.
- Only 6 of the 20 real effects are detected; 14 are missed.
- Now 10 winners are declared and 4 of them, 40%, are false.
Low power does not just miss good ideas. It makes the winners you do find less trustworthy, because the false ones make up a bigger share. That is why a team that runs many small, short tests often finds its "wins" do not add up in the quarterly numbers.
Tests with a real effect
20
of 100
False winners
4
at either power
Share of winners false
20% → 40%
▼ when power drops
100 A/B tests · α = 5%
Sample| Power | True winners | Missed effects | False winners | Winners that are false |
|---|---|---|---|---|
| 80% | 16 | 4 | 4 | 20% |
| 30% | 6 | 14 | 4 | 40% |
Assumes 1 idea in 5 has a real effect. Alpha fixes false winners at 5% of the 80 null tests.
Four habits that keep both errors low
- Calculate the sample size before you start. Pick the smallest effect worth acting on, the baseline rate, alpha and power, and compute how many visitors each variant needs. A 10% relative lift on a 3% conversion rate needs tens of thousands of visitors per variant.
- Do not stop when it looks good. Checking the result every day and stopping at the first "significant" reading pushes the real type 1 rate far above 5%. Run to the planned size, or use a method designed for continuous monitoring.
- Pick one primary metric. Testing ten metrics at α = 5% gives roughly a 40% chance that at least one looks significant by luck. Choose the decision metric in advance; treat the rest as context.
- Re-test or hold out big wins. For a change you are about to build on, confirm it with a second test or a holdout group. A real effect survives; a lucky one usually shrinks.
Which error is worse?
It depends on what each mistake costs. A false positive on a pricing change can cost revenue for months; there, a stricter alpha is worth the larger sample. A false negative on a cheap copy change costs little; a looser threshold and more tests may be the better programme. Decide the trade-off before the test, not when you see the result.
FAQ
Is a false positive type 1 or type 2?
Type 1. A false positive is rejecting the null hypothesis when it is true: you see an effect that is not there. A false negative, missing a real effect, is type 2.
What is the relationship between alpha, beta and power?
Alpha is the chance of a type 1 error, beta the chance of a type 2 error, and power is 1 − beta. For a fixed sample, lowering alpha raises beta. Increasing the sample lowers beta without changing alpha.
Does a p-value tell me the chance my result is a false positive?
No. A p-value is the chance of seeing a result at least this extreme if there were no real effect. The share of winners that are false also depends on how many of your ideas work and on power, as the example shows.
How can I reduce type 2 errors without more traffic?
Test bigger changes, use a metric closer to the change (a click on the new button rather than revenue), reduce noise by filtering bots and internal traffic, or run the test longer.
Related: statistical significance, p-value and correlation vs causation.
See also: Experimenter bias.
Was this article helpful?
We use your answers to fix and expand this page.
Couldn’t send. Please try again in a minute.
Thanks for the feedback. We’ll use it to improve this page.You’ve already sent feedback on this page. Thanks.

Product Analyst
Focuses on event analysis, conversion funnels, and retention, using clear metric definitions and structured analysis to explain product performance.