Try it on your own data
Every report in this article is in the free plan. One snippet for web and apps, up to 10 sites.
Start freeData analytics is split into four types: descriptive (what happened), diagnostic (why), predictive (what next) and prescriptive (what to do). This guide follows one store’s revenue drop through all four and says which ones a small team really needs.
What you will learn
- Descriptive says what happened; diagnostic, which most teams skip, says why
- Most requests for predictive analytics are really diagnostic questions
- Monitors and annotations shorten the path from what to why
The four types in one line each
Data analytics is usually split into four types, each answering a harder question than the one before:
- Descriptive analytics: what happened?
- Diagnostic analytics: why did it happen?
- Predictive analytics: what is likely to happen next?
- Prescriptive analytics: what should we do about it?
The table compares them on question, typical methods and the data each needs. The order matters: you cannot explain a change you have not measured, and a prediction built on data you have not diagnosed tends to repeat the same mistake.
| Type | Question | Typical methods | Data it needs |
|---|---|---|---|
| Descriptive | What happened? | Reports, dashboards, period comparisons | Clean metrics with fixed definitions |
| Diagnostic | Why did it happen? | Breakdowns, segments, funnels, replays, annotations | Data you can split by source, device, page, segment |
| Predictive | What will happen? | Trends, forecasts, churn or lead scores | History long enough to show patterns |
| Prescriptive | What should we do? | Playbooks, tests, optimisation | A trusted diagnosis and a way to measure the action |
Each type depends on the one above it.
One question through all four
A small online store opens its Monday dashboard. Here is what each type of analytics contributes.
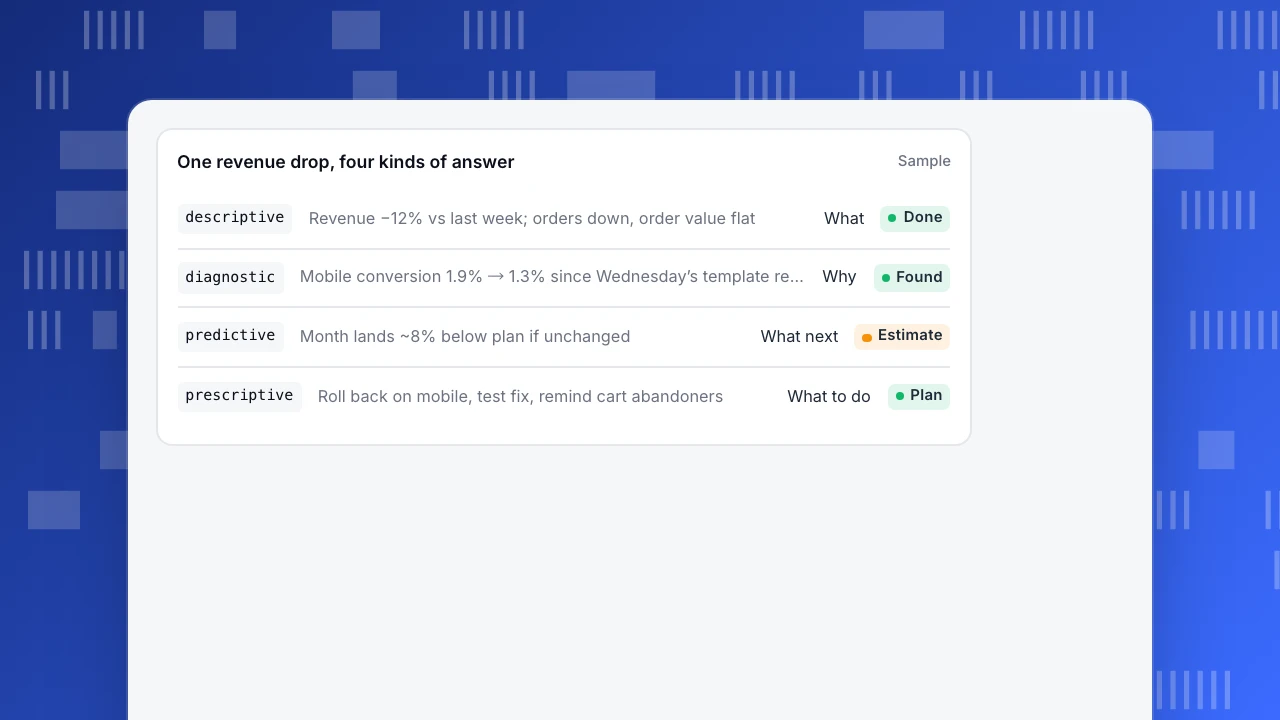
Descriptive. Revenue last week was 12% lower than the week before; orders fell, average order value did not. That is a fact, not yet an explanation. Most dashboards stop here, and that is where most teams start guessing.
Diagnostic. Split the drop. By channel, every source fell a little. By device, desktop held steady while mobile conversion dropped from 1.9% to 1.3%. By day, the fall starts on Wednesday, the day a new product page template shipped. Session replays on mobile show the "Add to cart" button pushed below a large image. Now there is a cause.
Predictive. If nothing changes, what does the month look like? A simple forecast from the last weeks says revenue lands about 8% below plan. A second, more useful prediction is per customer: which recent buyers are likely not to come back. Neither needs machine learning to start: a trend line and a recency rule go a long way.
Prescriptive. Roll the template back on mobile today, test the fix behind a split, and send the customers who abandoned carts since Wednesday a reminder. Prescriptive analytics is about ranking actions by expected effect and cost, and it is only as good as the diagnosis under it.
One revenue drop, four kinds of answer
SampledescriptiveRevenue −12% vs last week; orders down, order value flatWhatDonediagnosticMobile conversion 1.9% → 1.3% since Wednesday’s template releaseWhyFoundpredictiveMonth lands ~8% below plan if unchangedWhat nextEstimateprescriptiveRoll back on mobile, test fix, remind cart abandonersWhat to doPlan
Which ones you actually need
- Every team needs descriptive analytics done well: clear definitions, a few metrics per goal, and comparisons with the previous period. See how to build an analytics dashboard.
- Diagnostic is where most value hides. It needs data you can split (by source, device, page, segment) and the habit of splitting before guessing. Most "we need predictive analytics" requests are really diagnostic questions.
- Predictive is worth it when decisions repeat: forecasting stock or budget, spotting accounts likely to churn, scoring leads.
- Prescriptive starts as a written playbook (if this metric drops, check these three things, then do this), long before it is an optimisation model.
Getting from descriptive to diagnostic faster
Two habits shorten the path from "what happened" to "why":
- Let the tool tell you something changed. A monitor with a forecast band, for example in TapCub, compares today with the mean of the last seven days and the same weekday and fires when the value leaves the band (it needs 14 days of history; an anomaly rule uses 28). You start diagnosing on Wednesday, not the following Monday.
- Record what you changed. Releases, campaigns and price changes as annotations on the chart turn many diagnoses into a two-minute lookup.
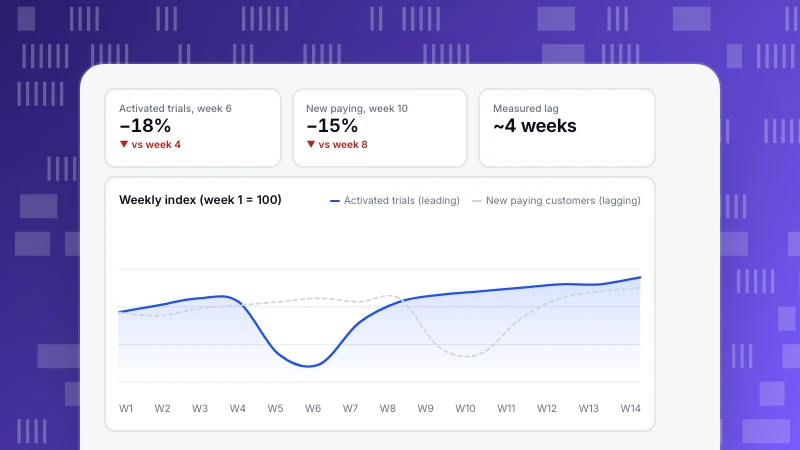
Keep leading and lagging indicators on the same screen: lagging ones (revenue) tell you something happened, leading ones (add-to-cart rate) tell you where.
FAQ
What is diagnostic analytics?
The analysis of why something happened: breaking a change down by dimensions such as channel, device, page or segment, checking timing against known events, and confirming the cause with more detailed data such as session replays.
What is the difference between predictive and prescriptive analytics?
Predictive estimates what will happen (next month's revenue, who will churn). Prescriptive recommends what to do about it (which customers to contact, which fix to ship first).
Which type of analytics is most common?
Descriptive. Every report and dashboard is descriptive analytics. The other three build on it.
Do I need data science for predictive analytics?
Not to begin. Trend lines, moving averages, seasonal comparisons and simple rules (no order in 60 days) answer many predictive questions. Models help when there are many signals and the decision repeats at scale.
See also: Digital analytics, Web analytics.
See also: What is diagnostic analytics? Methods and a worked example.
Was this article helpful?
We use your answers to fix and expand this page.
Couldn’t send. Please try again in a minute.
Thanks for the feedback. We’ll use it to improve this page.You’ve already sent feedback on this page. Thanks.

Product Experience Specialist
Writes about product experience, practical workflows, and growth, turning complex processes into clear steps for everyday decisions.