Try it on your own data
Every report in this article is in the free plan. One snippet for web and apps, up to 10 sites.
Start freeMost dashboards fail for the same reason: they show everything to everyone. This guide starts from the question a dashboard has to answer, gives starting layouts for four roles and a weekly website template, then walks through six build steps and the mistakes that make dashboards contradict themselves.
What you will learn
- A dashboard answers one reader's recurring question on one screen, in six to ten cards
- Starting layouts for founders, marketers, product teams and support
- A weekly website dashboard template with a status column, plus the summing mistakes to avoid
What an analytics dashboard is for
An analytics dashboard is one screen that answers one person's recurring question, such as "is the site healthy this week?" or "is the new onboarding working?", with the few numbers needed to decide whether anything needs attention. Stephen Few's often-quoted definition puts it the same way: the most important information for an objective, arranged on a single screen so it can be monitored at a glance (Few, Dashboard Confusion, 2004).
That definition rules out two common habits. A dashboard is not a report with every chart you have, and it is not a place to explore. Exploration happens in the analysis tools; the dashboard shows the handful of results you already decided to watch. If a card has not changed a decision in a month, it is decoration.
Three kinds of dashboards
Most dashboards fall into one of three jobs. Naming the job first saves you from building a board that tries to do all three and does none well.
| Kind | Who looks | How often | What it shows |
|---|---|---|---|
| Operational | Marketing, support, on-call | Daily or live | Today versus normal: traffic, sign-ups, errors, online visitors |
| Strategic | Founders, leadership | Weekly or monthly | A few outcome metrics with trend and target |
| Analytical | Product, growth | Per project | One question in depth: a funnel, a cohort, a feature |
An operational board needs short date ranges and alerts. A strategic board needs longer ranges, comparisons to the previous period and a written note on what changed. An analytical board is temporary: it lives as long as the project.
Layouts by role
Start from the question, then pick the cards. The table below is a starting layout for the four people who most often ask for a dashboard. Keep each board to six to ten cards; past that, people stop reading the bottom half.
Each card should state its definition in the title or the card description. "Visitors" means different things in different tools, and even inside one tool a total can be summed by day or deduplicated across the range (see why analytics tools show different numbers).
| Reader | Question | Cards to start with |
|---|---|---|
| Founder | Are we growing, and is it paying off? | Sign-ups, conversion rate, revenue, visitors trend, top sources |
| Marketing | Which channels and pages bring people who convert? | Sessions by channel, conversion rate by channel, top entry pages, campaign results |
| Product | Do new users reach value and come back? | Activation funnel, feature usage, week-1 retention, errors |
| Support / ops | Is anything broken or overloaded right now? | Online visitors, 404s, script errors, chat volume |
Keep each board to six to ten cards and write the definition in each card description.
A weekly website dashboard template
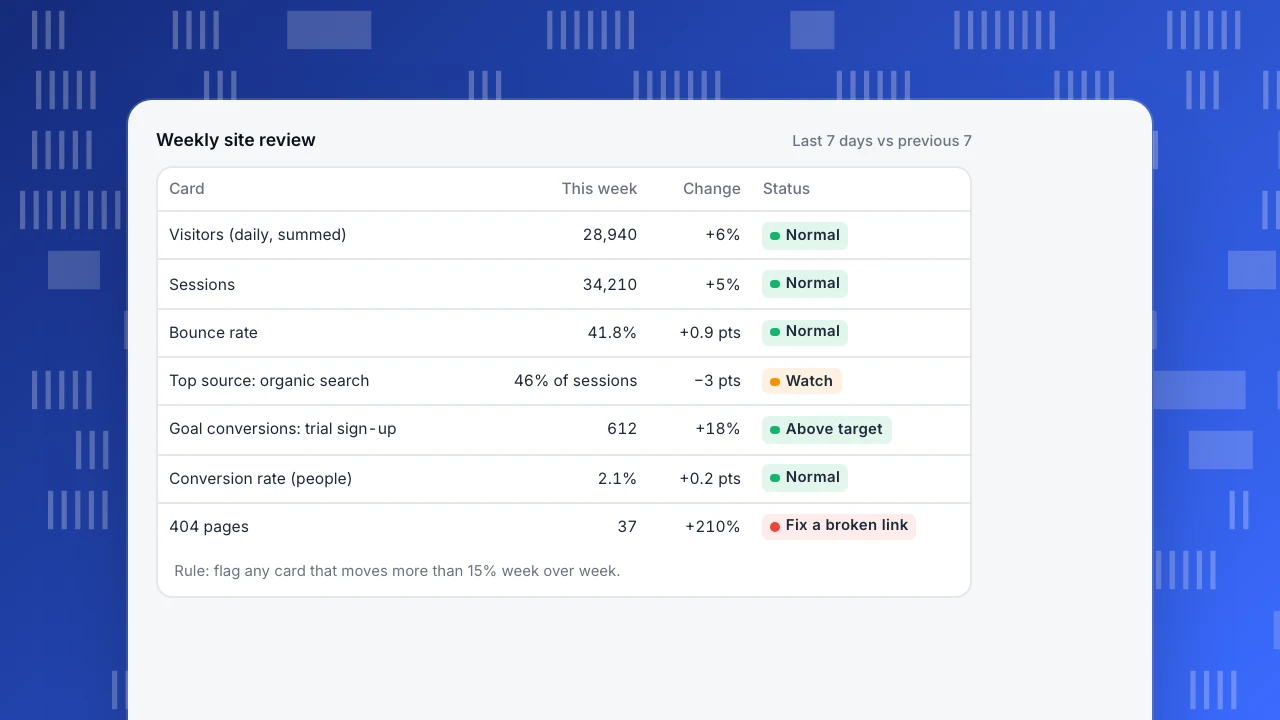
Here is a template for a weekly website review, the most common first dashboard. It answers three questions in order: did people come, did they do what we wanted, and did anything break. Each row is one card, compared with the previous seven days.
The status column is the point. A number without a "is this normal?" judgement forces every reader to make that judgement again. Write the rule once (for example, "flag when conversion rate moves more than 15% week over week") and let the board apply it.
Cards in this template, and why they are there:
- Visitors and sessions (session rules matter here): did traffic arrive?
- Pageviews per session and bounce rate: did people read more than one page?
- Top sources by channel: where did this week's visits come from, and did one source change a lot?
- Goal conversions and conversion rate: did visitors do the thing the site exists for?
- Top pages and top entry pages: which content carried the week?
- 404s and script errors: did anything break?
Weekly site review
Last 7 days vs previous 7| Card | This week | Change | Status |
|---|---|---|---|
| Visitors (daily, summed) | 28,940 | +6% | Normal |
| Sessions | 34,210 | +5% | Normal |
| Bounce rate | 41.8% | +0.9 pts | Normal |
| Top source: organic search | 46% of sessions | −3 pts | Watch |
| Goal conversions: trial sign-up | 612 | +18% | Above target |
| Conversion rate (people) | 2.1% | +0.2 pts | Normal |
| 404 pages | 37 | +210% | Fix a broken link |
Rule: flag any card that moves more than 15% week over week.
How to build a dashboard in six steps
- Write the question and the reader at the top of the board, in plain words. "Weekly site review for marketing" is enough.
- List the decisions the reader makes from it, such as moving budget between channels or fixing a broken page. Every card must support one of them.
- Pick six to ten metrics that inform those decisions, and write each definition in the card description: what is counted, which identity, which date range.
- Choose the chart per card. Use a single number with a comparison for status, a line for trends, a bar for ranking. Nielsen Norman Group notes that dashboards work when readers can spot differences at a glance, through position, length and colour, rather than reading every value (NN/g).
- Order the cards from outcome to cause: conversions and revenue at the top, traffic and sources below, diagnostics last.
- Set a review rhythm. A dashboard nobody opens on a schedule decays. Put the review in the calendar and remove any card that has not been discussed for a month.
In TapCub, a dashboard lives under All-platform analytics, Overview, My dashboards. A card is a saved analysis, a text block or a divider, and the board has its own date range, filters and identity; leave the identity alone and each card keeps its own. A board can be set as the default or pinned into the web, app or mini-program view (save and share).
Common dashboard mistakes
- Summing visitors across days. A total row that adds daily visitors counts a person who came on three days three times. In TapCub the overview card and the data-report total are summed this way; for people deduplicated across the range, use the range-wide figure the data report shows for ranges up to 93 days (metric definitions).
- Comparing two rates with different denominators. A goal conversion rate divides people by people; a report conversion rate divides conversions by sessions. Put them on the same board and someone will compare them.
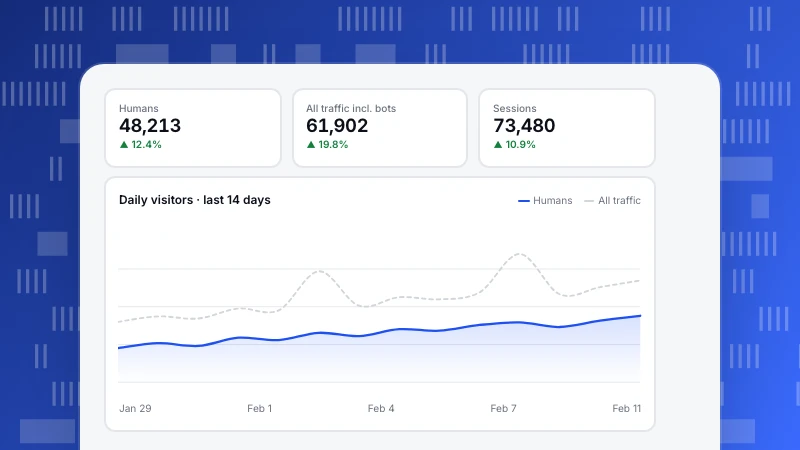
- Mixing humans and bots. If one card includes bot traffic and another does not, the board contradicts itself on crawl days.
- No comparison period. "4,180 visitors" says nothing; "4,180, up 6% on last week" does.
- Vanity cards. Total all-time sign-ups only ever goes up. Prefer rates and weekly counts.
- Too many cards. If the board scrolls three screens, split it by reader.
Sharing a dashboard without confusing people
Share the board with the definitions attached. In TapCub a shared dashboard is a read-only link (the password is optional), shows at most the last 90 days, and only allows filters on the project's share allowlist. Saving needs an analyst role or above; switching sharing on or off needs an admin or the owner.
When someone outside the team asks why a number differs from another tool, the answer is usually in the card description you wrote in step three. That is the cheapest documentation you will ever produce.
FAQ
What is the difference between a dashboard and a report?
A dashboard is a fixed screen of a few metrics that you check on a schedule to see whether anything needs attention. A report is a longer, often one-off document that explains a result in detail. Dashboards point at problems; reports and analyses explain them.
How many metrics should an analytics dashboard have?
Six to ten cards per board is a practical limit. If you need more, the board is probably serving two readers, and splitting it is better than shrinking the charts.
What should a website traffic report template include?
Visitors and sessions, top sources by channel, top pages, conversions and conversion rate, and an error or 404 count, each compared with the previous period. Add a one-line note on what changed and why.
Should a dashboard update in real time?
Only operational boards need to. Weekly and monthly boards are easier to read with complete days, because today's partial numbers always look like a drop.
Can I share a dashboard with people outside my team?
Yes, as a read-only link in TapCub, limited to the last 90 days and to the filters on the share allowlist. Add the definitions to the card descriptions before you send it.
See also: Product analytics dashboard, Web analytics report.
Was this article helpful?
We use your answers to fix and expand this page.
Couldn’t send. Please try again in a minute.
Thanks for the feedback. We’ll use it to improve this page.You’ve already sent feedback on this page. Thanks.

Product Experience Specialist
Writes about product experience, practical workflows, and growth, turning complex processes into clear steps for everyday decisions.