Try it on your own data
Every report in this article is in the free plan. One snippet for web and apps, up to 10 sites.
Start freeA product analytics dashboard shows how people use a product and whether that use is healthy. This guide lists the sections and metrics worth including, six steps to build a dashboard laid out from outcome to cause, and a weekly example where an activation gain explained why active workspaces grew despite fewer sign-ups.
What you will learn
- Lead with a north star and active users or accounts
- Define every metric next to its chart
- Lay out from outcome to cause
- Add comparisons and release annotations
- Review weekly in fifteen minutes or less
What is a product analytics dashboard?
A product analytics dashboard is a page of charts that shows how people use a product and whether that use is healthy: how many are active, whether new users reach value, which features they adopt, whether they come back, and how that turns into revenue. It is built from event data (sign-ups, feature use, sessions, purchases), not from page views alone.
A good product dashboard answers "is the product getting better for users?" at a glance, and lets a product manager drill from a changed number to the segment, feature or release behind it.
What to put on a product analytics dashboard
| Section | Metrics | Question |
|---|---|---|
| Headline | North star metric, weekly active users / accounts | Is the product delivering value at scale? |
| Acquisition | New sign-ups by channel, sign-up rate | Are the right people arriving? |
| Activation | Activation rate, time to value, onboarding funnel | Do new users reach the aha moment? |
| Engagement | DAU/MAU, core action frequency, sessions per user | Do active users use it regularly? |
| Feature adoption | Users of key features ÷ active users, new feature uptake | Which features matter? |
| Retention | Week-1 / week-4 cohort retention, lifecycle (new, returning, resurrected, dormant) | Do users keep coming back? |
| Revenue | Paying users, conversion to paid, MRR, expansion | Does use turn into revenue? |
| Quality | Errors, crash-free users, page or screen speed | Is something broken? |
Not every product needs every section. Start with the headline, activation, retention and one feature section, then add what your team actually reviews.
| Row | Contents |
|---|---|
| Top | North star, weekly active users / accounts |
| Middle | Activation, retention cohorts, lifecycle |
| Bottom | Feature adoption, revenue, quality |
People read top to bottom; put what matters most first.
How to build one in six steps
1. Choose the north star and its inputs
Pick one metric that reflects delivered value (for example "weekly active projects with at least one update") and two to four input metrics that drive it.
2. Define each metric precisely
Event, filter, identity (user or account), time window, and what counts as active. Write it next to the chart.
3. Lay out from outcome to cause
Top row: north star and active users. Middle: activation and retention. Bottom: feature adoption and quality. People read top to bottom; put what matters most first.
4. Add comparisons
Every chart needs a comparison period or a target. Cohort charts compare cohorts with each other.
5. Add release annotations
Mark releases, pricing changes and campaigns on charts so changes can be explained.
6. Review weekly
Use the dashboard in a short weekly product review: what moved, why, and what to investigate.
Example layout
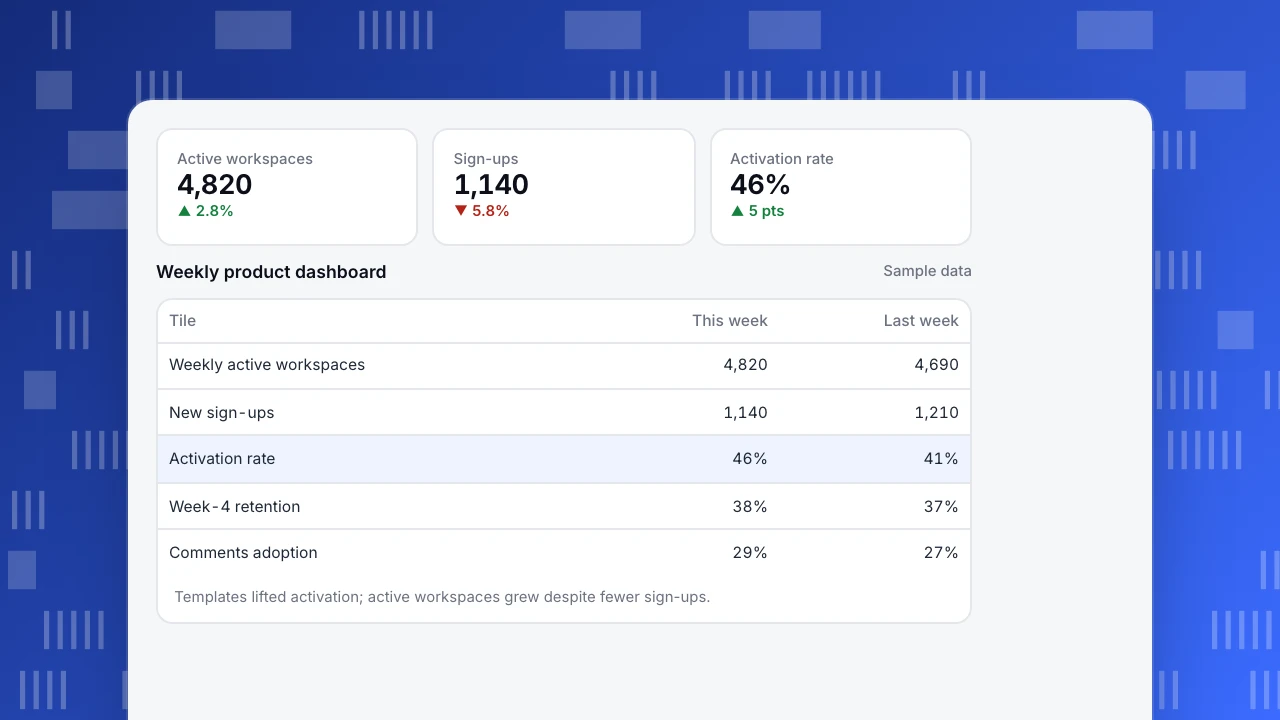
A B2B collaboration tool's weekly product dashboard (sample data):
| Tile | This week | Last week | Note |
|---|---|---|---|
| Weekly active workspaces (north star) | 4,820 | 4,690 | +2.8% |
| New sign-ups | 1,140 | 1,210 | Paid search budget reduced |
| Activation rate (workspace + 3 docs in 7 days) | 46% | 41% | New templates shipped |
| Week-4 retention (cohort from 4 weeks ago) | 38% | 37% | — |
| Comments feature adoption | 29% | 27% | — |
| Paid conversion (trials ending this week) | 18% | 18% | — |
| Sessions with JavaScript errors | 1.2% | 1.1% | — |
Sign-ups fell, but activation rose five points after templates shipped, so active workspaces still grew. Without the activation tile, the team might have reacted to the sign-up drop by increasing ad spend.
Active workspaces
4,820
▲ 2.8%
Sign-ups
1,140
▼ 5.8%
Activation rate
46%
▲ 5 pts
Weekly product dashboard
Sample data| Tile | This week | Last week |
|---|---|---|
| Weekly active workspaces | 4,820 | 4,690 |
| New sign-ups | 1,140 | 1,210 |
| Activation rate | 46% | 41% |
| Week-4 retention | 38% | 37% |
| Comments adoption | 29% | 27% |
Templates lifted activation; active workspaces grew despite fewer sign-ups.
Common mistakes
- Vanity metrics on top. Total sign-ups and page views say little about product health.
- User-level metrics for team products. Track accounts or workspaces where buying and retention happen.
- No definitions. Ambiguous "active" breaks trust in the dashboard.
- Too many charts. If the review takes more than fifteen minutes, cut charts.
- No link to action. Each chart should have an owner and a question it answers.
Building a product analytics dashboard in TapCub
- Insights: build trends, funnels, retention, paths and distributions from events and save them as insights; see create custom metrics.
- Dashboards: pin saved insights to a dashboard, share it or schedule email reports.
- Accounts: analyze accounts with groups for B2B workspaces.
- Lifecycle and retention: new, returning, resurrecting and dormant per week or month; cohort retention by first-use date.
- Annotations: mark releases on charts; see add chart annotations.
Related: KPI dashboard, north star metric, product health metrics, analytics dashboard.
FAQ
What metrics should a product analytics dashboard include? A north star metric, active users or accounts, activation, retention, adoption of key features, conversion to paid and a quality signal such as errors.
How is a product dashboard different from a marketing dashboard? A marketing dashboard focuses on traffic, campaigns and leads. A product dashboard focuses on what users do inside the product after they sign up.
How often should the dashboard be reviewed? Weekly in a short product review, with monthly deep dives into retention and adoption.
Should B2B products track users or accounts? Both, but headline metrics should usually be account-level, because accounts buy, renew and expand.
Sources
- Amplitude. The North Star Playbook.
- Google Research. Measuring the user experience on a large scale: the HEART framework.
Was this article helpful?
We use your answers to fix and expand this page.
Couldn’t send. Please try again in a minute.
Thanks for the feedback. We’ll use it to improve this page.You’ve already sent feedback on this page. Thanks.

Product Adoption Consultant
Explores customer onboarding, live conversations, and self-service, turning common usage questions into practical guidance and improvements.