Try it on your own data
Every report in this article is in the free plan. One snippet for web and apps, up to 10 sites.
Start freeMost KPI dashboards fail because they show too much and judge nothing. This guide gives eight design rules, walks through a sample company dashboard where every number has a target and a status, and shows how to build one in six steps.
What you will learn
- Show five to nine KPIs, each with a target, a comparison and an owner
- Use colour only for status: on track, at risk, off track
- Define each KPI once and use that definition everywhere, or the dashboard will not be trusted
What a KPI dashboard is
A KPI dashboard is a single screen with the few numbers a team or company has agreed matter most, each shown against a target, so anyone can tell within a minute what is on track and what needs attention.
That makes it different from a report (which explores) and from an operational dashboard (which shows many live numbers for people running a process). A KPI dashboard is for checking direction and deciding where to look.
Eight design rules
The table below lists the rules that make the difference between a dashboard that gets opened every Monday and one that gets ignored.
| Rule | Why |
|---|---|
| Five to nine KPIs | More than that and nothing is key |
| Every KPI has a target or range | Otherwise it cannot be on or off track |
| Every KPI has a comparison | Last period or same period last year gives context |
| Colour only for status | Decorative colour hides the red that matters |
| Most important top left | People read screens like a page |
| Trend next to each number | A small line shows direction at a glance |
| One definition, written down | Prevents arguments over whose number is right |
| An owner per KPI | Someone explains each change |
If a tile has not changed a decision in a quarter, remove it.
A sample company KPI dashboard
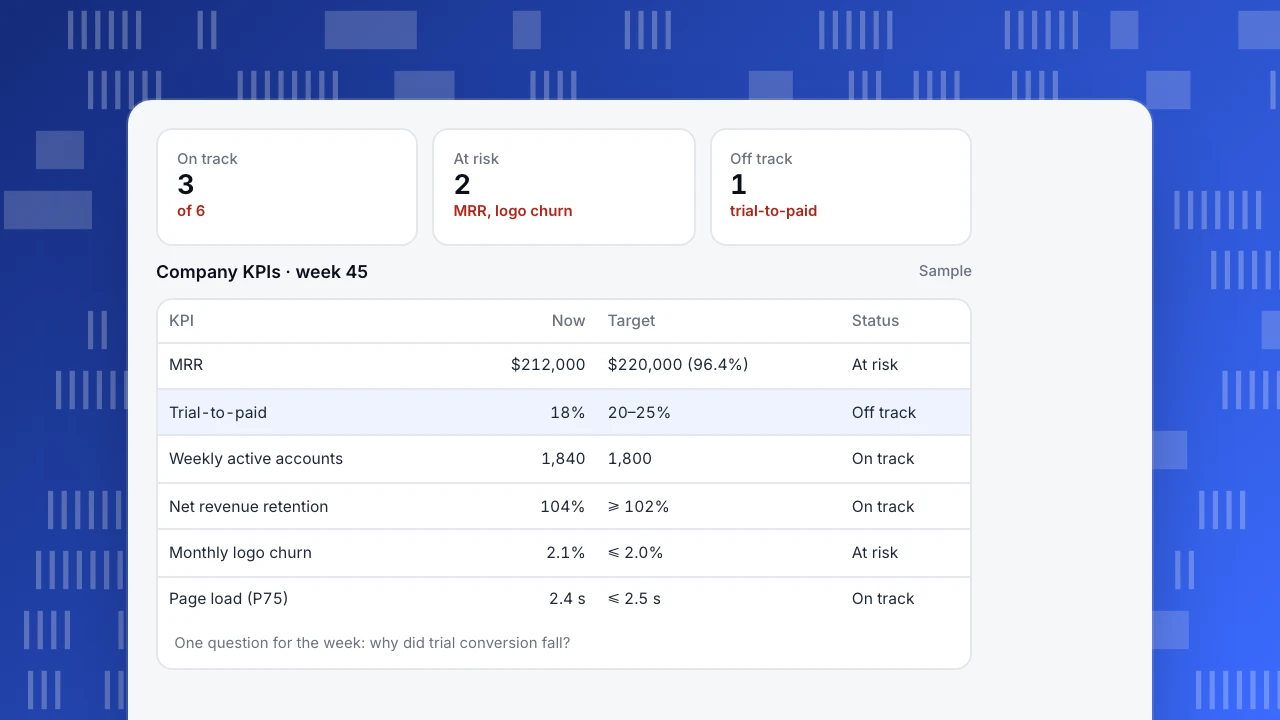
A SaaS company's Monday view (sample numbers):
- MRR: $212,000 against a $220,000 month-end target, 96.4% with a week to go: at risk.
- Trial-to-paid conversion: 18% against a 20–25% healthy range: off track.
- Weekly active accounts: 1,840 against 1,800: on track.
- Net revenue retention: 104% against at least 102%: on track.
- Monthly logo churn: 2.1% against at most 2.0%: at risk.
- Page load (P75): 2.4 s against at most 2.5 s: on track.
Six numbers, three colours, one clear question for the week: why did trial conversion fall? The dashboard does not answer it; it points to where the answer is.
On track
3
of 6
At risk
2
MRR, logo churn
Off track
1
trial-to-paid
Company KPIs · week 45
Sample| KPI | Now | Target | Status |
|---|---|---|---|
| MRR | $212,000 | $220,000 (96.4%) | At risk |
| Trial-to-paid | 18% | 20–25% | Off track |
| Weekly active accounts | 1,840 | 1,800 | On track |
| Net revenue retention | 104% | ≥ 102% | On track |
| Monthly logo churn | 2.1% | ≤ 2.0% | At risk |
| Page load (P75) | 2.4 s | ≤ 2.5 s | On track |
One question for the week: why did trial conversion fall?
Building one in six steps
- Name the audience. The leadership dashboard and the growth team's dashboard are different.
- Pick five to nine KPIs. Start from goals, often a north star metric and the inputs that drive it. Mix leading and lagging indicators.
- Write one definition per KPI: event, filter, time window, owner. Put it on the dashboard or one click away.
- Set targets and ranges. A number without a target cannot be on or off track.
- Lay it out: most important top left, one row per theme, comparisons next to each number.
- Agree the ritual. Who looks, when, and what happens when a KPI goes red.
Common mistakes
- Too many tiles. Thirty numbers means none is key.
- Vanity numbers. Total sign-ups since launch only goes up; it never tells you to act.
- Different definitions in different places. If the dashboard and the finance sheet disagree, people stop trusting both.
- No owner. Every KPI needs a person who explains a change.
- Never revisiting it. Review the KPI list each quarter, especially after OKRs change.
Setting it up in TapCub
- Define each KPI once as a custom metric in All-platform analytics › Behavior › Metrics & SQL, for example "accounts with a paid event ÷ trial accounts", so every chart uses the same formula.
- Build the board in All-platform analytics › Overview › My dashboards. Cards are saved analyses, text blocks or dividers; the board has its own date range and filters. Use a text card for each KPI's definition and target.
- Make it the default so it opens first, and share a read-only link with people outside the project (shared boards show at most the last 90 days).
- Get alerted with a monitor on each KPI with a hard limit, so you do not have to wait for Monday.
See also: Customer experience dashboard, Product analytics dashboard.
Was this article helpful?
We use your answers to fix and expand this page.
Couldn’t send. Please try again in a minute.
Thanks for the feedback. We’ll use it to improve this page.You’ve already sent feedback on this page. Thanks.

Product Experience Specialist
Writes about product experience, practical workflows, and growth, turning complex processes into clear steps for everyday decisions.