Try it on your own data
Every report in this article is in the free plan. One snippet for web and apps, up to 10 sites.
Start freeA customer experience dashboard shows how customers experience your business across the journey: product friction, support speed, satisfaction and retention. This guide lists the metrics worth including with their definitions, five steps to build a dashboard people use, and a weekly example where reading the tiles together exposed a payment bug rather than a staffing problem.
What you will learn
- Combine behavior, support, perception and outcome metrics
- Define every metric once, with formula and window
- Show trend, comparison and target on every tile
- Make tiles drill down to pages, agents and conversations
- Keep it small: one or two metrics per group
What is a customer experience dashboard?
A customer experience (CX) dashboard is a single view of how customers experience your business across the journey: how easily they use the website or app, how quickly support helps them, how satisfied they are, and whether they stay. It combines behavioral data (what people do), service data (how support performs) and feedback data (what people say), so a team can spot a problem early and see whether a fix worked.
A useful CX dashboard is small. It shows a handful of metrics tied to decisions, each with a trend and a comparison period, and lets you drill into the segment or page behind a change.
What to put on a CX dashboard
| Group | Metric | Definition | Why it matters |
|---|---|---|---|
| Digital experience | Task or goal completion rate | Sessions that reach a key goal ÷ sessions | Shows whether the product works for users |
| Friction rate | Sessions with errors or rage clicks ÷ sessions | Early warning before complaints arrive | |
| Core Web Vitals pass rate | Pages meeting LCP, INP, CLS thresholds | Slow pages hurt every other metric | |
| Support | First response time | Time from first message to first agent reply (median) | The most visible part of service speed |
| Resolution rate | Resolved conversations ÷ conversations | Shows whether problems get solved | |
| Contacts per 1,000 sessions | Support conversations relative to traffic | Rising contact rate signals confusion | |
| Perception | Satisfaction (CSAT) | Average post-chat rating or % of 4–5 ratings | Direct customer judgment of the help |
| Net Promoter Score (NPS) | % promoters − % detractors (0–10 survey) | Relationship-level loyalty | |
| Outcomes | Retention / churn | Customers active this period who were active last period | The result CX should move |
| Conversion after support | Goal rate of visitors who chatted vs those who did not | Shows support's effect on revenue |
You rarely need all of them. Pick one or two per group that your team can influence.
How to build a CX dashboard in five steps
1. Start from the journey
List the moments that matter (first visit, sign-up, first use, purchase, support contact, renewal) and choose one metric for each. This keeps the dashboard tied to customer reality, not to whatever data is easy to pull.
2. Define every metric once
Write the formula, the time window and the population for each tile. "Response time" can mean first response, average response or resolution time; teams argue about numbers when definitions are vague.
3. Add comparison and targets
Every tile needs a trend and a comparison period (previous period or same period last year). Add a target or a threshold where you have one: "median first response under 2 minutes", "satisfaction at least 4.5".
4. Make it drillable
A drop in satisfaction should lead to the conversations, agents or pages behind it. A rise in friction should lead to the pages and devices where errors happen.
5. Review it on a schedule
Daily for operational tiles (response time, open conversations), weekly for experience tiles, monthly for outcomes like churn and NPS. Assign an owner to each tile.
| Review cadence | Tiles |
|---|---|
| Daily | First response, open conversations, errors |
| Weekly | Goal completion, friction, satisfaction, contacts per 1,000 sessions |
| Monthly | Retention, churn, NPS, conversion after support |
Assign one owner to each tile.
Example layout
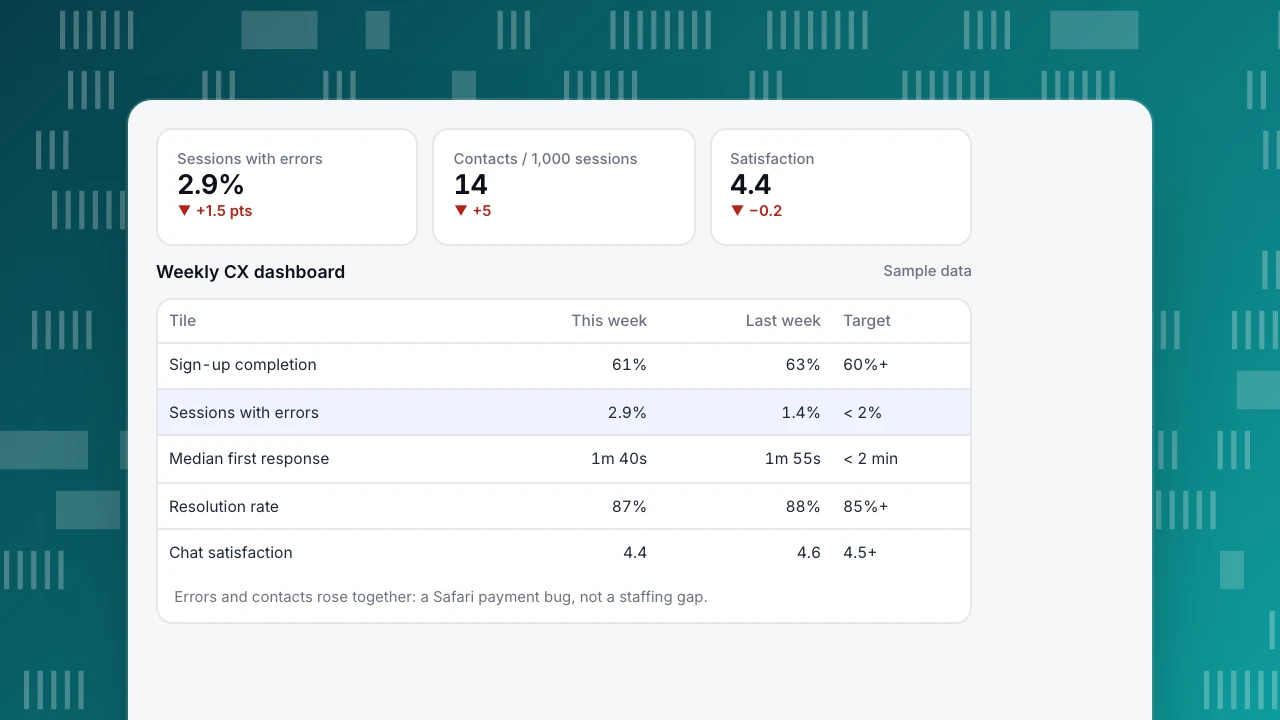
A software company's weekly CX dashboard (sample data):
| Tile | This week | Previous week | Target |
|---|---|---|---|
| Sign-up completion | 61% | 63% | 60%+ |
| Sessions with errors | 2.9% | 1.4% | under 2% |
| Median first response | 1 min 40 s | 1 min 55 s | under 2 min |
| Resolution rate | 87% | 88% | 85%+ |
| Chat satisfaction (1–5) | 4.4 | 4.6 | 4.5+ |
| Contacts per 1,000 sessions | 14 | 9 | under 10 |
Read together, the story is clear: errors doubled, contacts rose by half and satisfaction dipped while support speed improved. Drilling into the error tile showed a payment-form bug on Safari introduced in a release that week. Support was answering fast, but customers were contacting it about a broken product. Fixing the bug, not adding agents, was the right response.
Sessions with errors
2.9%
▼ +1.5 pts
Contacts / 1,000 sessions
14
▼ +5
Satisfaction
4.4
▼ −0.2
Weekly CX dashboard
Sample data| Tile | This week | Last week | Target |
|---|---|---|---|
| Sign-up completion | 61% | 63% | 60%+ |
| Sessions with errors | 2.9% | 1.4% | < 2% |
| Median first response | 1m 40s | 1m 55s | < 2 min |
| Resolution rate | 87% | 88% | 85%+ |
| Chat satisfaction | 4.4 | 4.6 | 4.5+ |
Errors and contacts rose together: a Safari payment bug, not a staffing gap.
Common mistakes
- Too many tiles. A wall of 40 charts hides the two that changed.
- Only service metrics. Fast responses do not help if the product keeps generating the same complaint.
- Survey scores without volume. A 4.8 satisfaction from 12 ratings is noise; show the count.
- No link between CX and revenue. Add at least one outcome metric (retention, conversion after support).
- Static snapshots. A number without trend and comparison invites the wrong reaction.
Building a CX dashboard with TapCub
TapCub puts analytics and live chat on the same visitor ID, so behavior and support can sit on one dashboard:
- Support: Live chat › Reports gives conversations, resolution rate, average and median first response, satisfaction (1–5, collected within 24 hours of resolving), agent workload, busy hours and the pages where chats start. AI replies are not counted as first response.
- Support's effect: Conversion attribution compares the goal rate of visitors who chatted with those who did not on the same day, and warns when fewer than 30 visitors chatted.
- Digital experience: goals, funnels, JavaScript errors, rage clicks and real-user Core Web Vitals.
- Dashboards: pin these to a custom dashboard and share it or schedule email reports.
TapCub does not run NPS surveys; bring NPS from your survey tool. See also KPI dashboard and first response time.
FAQ
What is the difference between a CX dashboard and a customer service dashboard? A customer service dashboard focuses on support operations (volume, response, resolution, agents). A CX dashboard also includes the digital experience and outcomes such as retention and conversion.
Which CX metric matters most? The one closest to your business outcome that your team can act on. For most online businesses that is a mix of goal completion and retention, explained by friction and support metrics.
How often should a CX dashboard be updated? Operational tiles in near real time or daily; experience and satisfaction weekly; churn and NPS monthly or quarterly.
Should CSAT and NPS both be on the dashboard? They answer different questions: CSAT judges a specific interaction, NPS judges the relationship. Use CSAT for support quality and NPS for overall loyalty if you survey for it.
Sources
- Bain & Company. Introducing the Net Promoter System.
- Qualtrics XM Institute. What is CSAT and how do you measure it?
- web.dev. Web Vitals.
Was this article helpful?
We use your answers to fix and expand this page.
Couldn’t send. Please try again in a minute.
Thanks for the feedback. We’ll use it to improve this page.You’ve already sent feedback on this page. Thanks.

Growth Strategist
Explores acquisition channels, activation, and conversion experiments, turning data insights into actionable growth hypotheses and evaluation methods.