Try it on your own data
Every report in this article is in the free plan. One snippet for web and apps, up to 10 sites.
Start freeCustomer experience metrics measure satisfaction, effort, support speed and whether customers stay. This guide lists ten metrics with formulas across perception, operations and outcomes, explains how to choose and segment them, and shows a month where replies got faster but satisfaction fell because of a product bug support could not fix.
What you will learn
- Combine perception, operational and outcome metrics
- Write one formula per metric and keep it stable
- Use medians and percentiles for times
- Read survey scores next to behavioral data
- Keep metrics that move with retention
What are customer experience metrics?
Customer experience (CX) metrics measure how customers perceive and get through their interactions with a business: how satisfied they are, how much effort things take, how quickly they get help, and whether they stay and recommend you. They fall into three families: perception metrics from surveys (CSAT, NPS, CES), operational metrics from support and product data (response time, resolution, task completion, errors), and outcome metrics (retention, churn, repeat purchase, lifetime value).
No single metric captures customer experience. A useful set combines one or two from each family, with clear formulas so everyone reads them the same way.
The main customer experience metrics
| Metric | Formula | Measures | Notes |
|---|---|---|---|
| CSAT (customer satisfaction) | Satisfied responses (4–5 on a 5-point scale) ÷ responses × 100, or average score | Satisfaction with a specific interaction | Ask right after the interaction |
| NPS (Net Promoter Score) | % promoters (9–10) − % detractors (0–6) | Willingness to recommend; relationship loyalty | Ranges from −100 to +100 |
| CES (customer effort score) | Average agreement with "it was easy to…" (e.g., 1–7) | Effort to get something done | Strong predictor of loyalty in service contexts |
| First response time (FRT) | Median time from first message to first human reply | Support speed | Report the median and the 90th percentile |
| Resolution rate | Resolved conversations ÷ conversations | Whether problems get solved | Define "resolved" consistently |
| Time to resolution | Median time from first message to resolution | End-to-end support speed | Separate simple and complex issues |
| First contact resolution | Issues resolved in the first conversation ÷ issues | Efficiency without back-and-forth | Needs reopen tracking |
| Task completion rate | Users who complete a key task ÷ users who start it | Product ease of use | From funnels and goals |
| Churn rate | Customers lost in period ÷ customers at start | Outcome of experience | Pair with cancellation reasons |
| Retention rate | Customers at end − new customers, ÷ customers at start | Outcome of experience | Use cohorts for detail |
| Family | Examples | Source |
|---|---|---|
| Perception | CSAT, NPS, CES | Surveys |
| Operational | First response, resolution, task completion, errors | Support and product data |
| Outcome | Retention, churn, repeat purchase, LTV | Billing and analytics |
Pick one or two from each family.
How to choose and use CX metrics
1. Map metrics to the journey
Assign one metric per key moment: onboarding (task completion), first support contact (FRT, CSAT), renewal (churn). This shows where the experience breaks.
2. Combine perception with behavior
Survey scores tell you how people feel; behavioral data shows what they did. A falling CSAT with rising error rates points to a product problem, not a support one.
3. Report distributions, not just averages
Medians and percentiles for times; score distributions and response counts for surveys. A 4.6 average from 15 ratings is noise.
4. Segment
By plan, channel, country, language, device and new vs established customers. Experience problems are rarely evenly spread.
5. Tie metrics to outcomes
Check which metrics move with retention or revenue in your data. Focus on those.
Worked example: what really moved satisfaction
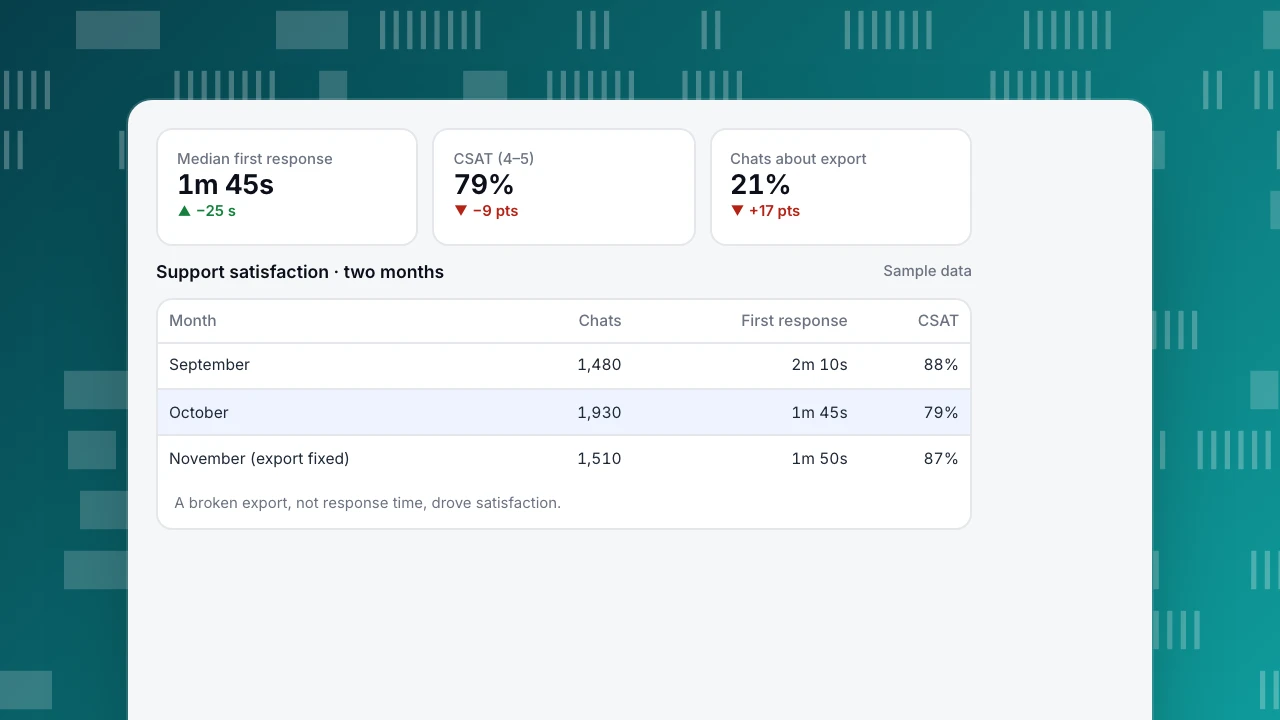
A SaaS support team (sample data) tracked satisfaction for two months:
| Month | Chats | Median first response | Resolution rate | CSAT (4–5) | Chats mentioning "export" |
|---|---|---|---|---|---|
| September | 1,480 | 2 min 10 s | 86% | 88% | 4% |
| October | 1,930 | 1 min 45 s | 84% | 79% | 21% |
Response time improved, yet satisfaction fell nine points. One topic explained most of it: a broken CSV export after a release, which support could acknowledge but not resolve. Chats about it rated an average of 2.9 vs 4.6 for others. Fixing the export restored CSAT to 87% in November. Faster replies were never the lever.
Median first response
1m 45s
▲ −25 s
CSAT (4–5)
79%
▼ −9 pts
Chats about export
21%
▼ +17 pts
Support satisfaction · two months
Sample data| Month | Chats | First response | CSAT |
|---|---|---|---|
| September | 1,480 | 2m 10s | 88% |
| October | 1,930 | 1m 45s | 79% |
| November (export fixed) | 1,510 | 1m 50s | 87% |
A broken export, not response time, drove satisfaction.
Common mistakes
- Tracking NPS only. It is a relationship metric and moves slowly; it will not explain last week's problem.
- Averages for times. A few long cases distort the mean; use medians and percentiles.
- Survey fatigue. Ask briefly and at the right moment; long surveys get few, biased answers.
- Separating support data from product data. Many CX problems start in the product.
- No definitions. "Resolved" and "response time" must mean the same thing every month.
Measuring customer experience in TapCub
- Support metrics: Live chat › Reports shows conversations, resolution rate, average and median first response, satisfaction (1–5, rated within 24 hours of resolve), agent workload, busy hours and the pages where chats start. AI replies do not count toward first response. See first response time and resolution rate.
- Chat vs no-chat conversion: compares the goal rate of visitors who chatted with those who did not.
- Product experience: goals and funnels for task completion, JavaScript errors, rage clicks and Core Web Vitals.
- Outcomes: retention cohorts, lifecycle (new, returning, resurrecting, dormant) and revenue.
TapCub does not run NPS or CES surveys; bring those scores from your survey tool. Related: customer experience dashboard, customer health score.
FAQ
What is the most important customer experience metric? There is no single one. Most teams combine a satisfaction metric (CSAT or CES), an operational metric (response or resolution time, task completion) and an outcome metric (retention or churn).
What is the difference between CSAT and NPS? CSAT measures satisfaction with a specific interaction; NPS measures overall willingness to recommend the company.
What is a good first response time for live chat? Customers using chat expect a reply within a minute or two. Track the median and the 90th percentile and set a target that fits your staffing.
How do I measure customer effort? Ask a single question after a task or interaction, such as "The company made it easy for me to handle my issue", on a 1–7 agreement scale, and average the answers.
See also: What does CX mean? Customer experience explained.
Sources
- Bain & Company. The Net Promoter System.
- Dixon, M., Freeman, K. and Toman, N. (2010). Stop trying to delight your customers. Harvard Business Review.
- Qualtrics XM Institute. What is CSAT?
Was this article helpful?
We use your answers to fix and expand this page.
Couldn’t send. Please try again in a minute.
Thanks for the feedback. We’ll use it to improve this page.You’ve already sent feedback on this page. Thanks.

Growth Strategist
Explores acquisition channels, activation, and conversion experiments, turning data insights into actionable growth hypotheses and evaluation methods.