Try it on your own data
Every report in this article is in the free plan. One snippet for web and apps, up to 10 sites.
Start freeCustomer journey optimization measures the journey customers already take and improves the stages where they stall, get frustrated or leave. This guide shows how to turn a journey map into measurable stages, which friction signals explain each drop, and a SaaS example where chat transcripts pointed to the fix that lifted activation from 48% to 61%.
What you will learn
- Define stages as pages or events you can measure
- Measure reach, stage-to-stage movement and time between stages
- Use errors, rage clicks, exits and support chats to explain drops
- Segment by channel and device before acting
- Extend the journey past the first purchase
What is customer journey optimization?
Customer journey optimization is the practice of measuring a journey that customers already take (from first visit to purchase and beyond) and improving the stages where they stall, get frustrated or leave. It differs from journey mapping, which describes the journey, and from journey orchestration, which automates messages along it. Optimization is the measure-fix-measure loop on top of both.
A useful definition of success is concrete: more customers move from one stage to the next, in less time, with fewer errors and support contacts along the way.
Journey mapping vs optimization
| Journey mapping | Journey optimization | |
|---|---|---|
| Question | What steps do customers take? | Which step loses the most customers, and why? |
| Input | Interviews, workshops, assumptions | Behavioral data, errors, support conversations, feedback |
| Output | A diagram of stages and touchpoints | A ranked list of fixes with before/after numbers |
| Cadence | Once, revised occasionally | Continuous |
Start with a simple map; you need agreed stage definitions before you can measure them. Then let data tell you where to spend effort.
| Signal | What it suggests |
|---|---|
| High exit on a stage | The page does not answer the next question |
| Rage clicks | Something looks interactive but does not respond |
| JavaScript errors | A broken step, often on one browser or device |
| Repeated chat questions | Missing information or a missing feature |
Movement shows where customers leave; friction signals show why.
How to optimize a customer journey in six steps
1. Define stages you can measure
Translate the map into observable behavior. For a SaaS site: landing page → pricing page → sign-up started → account created → first project set up → paid. For a store: product page → cart → checkout → payment → repeat order. Each stage should be a page pattern or an event, not a feeling.
2. Measure reach and stage-to-stage movement
For each stage record how many sessions or people reach it and what share move to the next stage. The biggest absolute loss is usually the first place to look, but also compare time between stages: a step that takes days may need a reminder rather than a redesign.
3. Find friction signals at each stage
Movement tells you where people leave; friction signals tell you why. Look at JavaScript errors, rage clicks, exits, form field drop-off, and support conversations that mention the stage ("I can't find the invoice", "the code doesn't work").
4. Segment the journey
Compare the same journey by channel, device, country and new versus returning customers. A checkout that works on desktop but loses half of mobile users is a mobile problem, not a checkout problem.
5. Fix the highest-impact stage and re-measure
Pick one stage, make a change and compare the same stage's movement before and after, on matching weekdays. Combine quantitative change with a few session replays or support transcripts to confirm the fix addressed the cause.
6. Close the loop with customers
Journeys extend beyond your website: onboarding emails, support, renewals. Add the stages you can measure (email clicks, chat conversations, renewal events) so the map does not stop at the first purchase.
Worked example: a SaaS sign-up journey
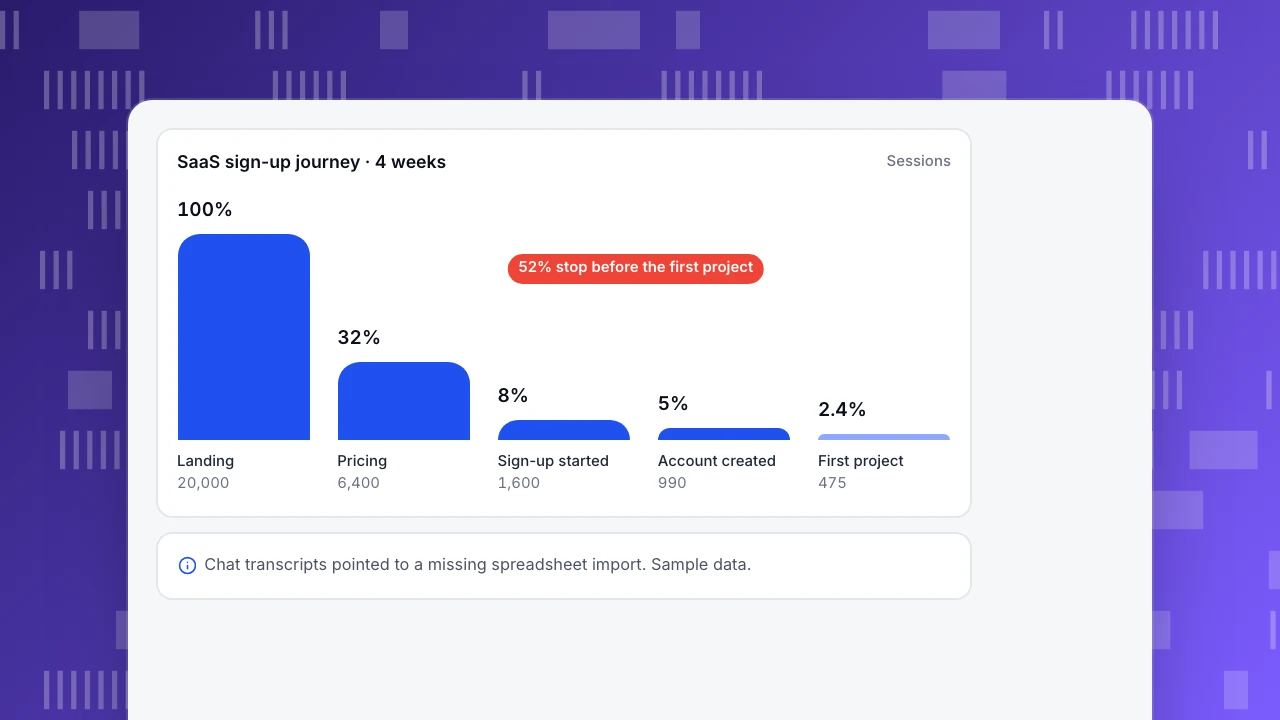
A project management SaaS (sample data) defines five stages and measures four weeks of sessions:
| Stage | Sessions | Moved to next | Friction signals |
|---|---|---|---|
| Landing page | 20,000 | 32% to pricing | Exit rate 54% |
| Pricing | 6,400 | 25% start sign-up | Rage clicks on plan toggle |
| Sign-up started | 1,600 | 62% create account | 11% hit an error on email verification |
| Account created | 990 | 48% create first project | Chat: "how do I import from spreadsheets?" |
| First project | 475 | — | — |
The largest relative loss inside the product is account created → first project (52% stop). Chat transcripts point to a missing spreadsheet import. Adding a CSV import on the empty project screen raised that step from 48% to 61% in the next four weeks, about 130 more activated accounts a month from the same traffic. The email verification error came next.
SaaS sign-up journey · 4 weeks
SessionsLanding
20,000
Pricing
6,400
Sign-up started
1,600
Account created
990
First project
475
Common mistakes
- Optimizing a map nobody measured. Stages built from assumptions often skip steps customers really take.
- Looking only at conversion rates. Errors, frustration and support contacts explain why a rate moved.
- Fixing every stage at once. You lose the ability to tell what worked.
- Stopping at the first purchase. Onboarding, support and renewal stages often decide lifetime value.
- Treating all customers the same. Segment by channel and device before drawing conclusions.
Customer journey optimization in TapCub
- Journey maps: All-platform analytics › Business › Journey maps lets you define up to 20 stages from page patterns and events. Each stage shows people and sessions, movement to the next stage, and a sentiment score (0–100) that drops with error, rage-click and exit rates on that stage.
- Paths and funnels: use path analysis to discover routes you did not plan for, and funnels for strict step-by-step conversion.
- Friction: rage clicks, JavaScript errors, heatmaps and session replay (off by default) show what happens inside a stage.
- Support: live chat conversations are linked to the visitor's pages, so you can see which stage a question came from.
Related reading: customer journey map and customer journey analytics.
FAQ
What is the difference between customer journey optimization and conversion rate optimization? Conversion rate optimization usually focuses on one page or one funnel step. Journey optimization looks at the whole sequence of stages, including post-purchase ones, and picks the stage with the most impact.
What data do I need to optimize a customer journey? Stage-level behavior (pages and events), friction signals (errors, rage clicks, exits) and qualitative input such as support conversations or surveys.
How often should a journey be reviewed? Check stage movement monthly and after any release that touches a stage. Revisit the stage definitions when the product or pricing changes.
Which stage should I fix first? The one where the most customers are lost relative to the value of moving them forward, adjusted for how easy the fix is.
Sources
- Nielsen Norman Group. Journey mapping 101.
Was this article helpful?
We use your answers to fix and expand this page.
Couldn’t send. Please try again in a minute.
Thanks for the feedback. We’ll use it to improve this page.You’ve already sent feedback on this page. Thanks.

Product Experience Specialist
Explores usability, user journeys, and feature adoption through practical examples of onboarding and everyday product use.