Try it on your own data
Every report in this article is in the free plan. One snippet for web and apps, up to 10 sites.
Start freeA customer journey map is a picture of how you think people reach a purchase. Customer journey analytics checks that picture against what people actually did, across visits, channels and devices. This guide explains the four analyses it is built from, which question each answers, and walks through a sample from trial sign-up to paid.
What customer journey analytics is
Customer journey analytics is the practice of measuring the sequence of things people do on their way to, and after, becoming a customer. It uses event data across visits, channels and devices, rather than survey answers or a workshop diagram.
A customer journey map says what you expect. Journey analytics tells you what happened and where the expected route breaks.
The four analyses behind it
Journey analytics is not one report. It is a handful of analyses, each answering a different question. The table maps them.
In TapCub, paths run forward from a start or backward from an end, with 2 to 10 steps, counted by session or by person. Funnels show the median time from each step to the next. A person's profile shows a day-by-day timeline.
| Analysis | Question it answers | Example |
|---|---|---|
| Funnel | How many get through the steps we expect? | Trial → setup → invite → paid |
| Paths | What do people actually do after (or before) a point? | What happens after the pricing page |
| Person timeline | What did this one customer do? | A churned account, day by day |
| Cohorts and retention | Do people who started at a given time stay? | Weekly sign-up cohorts, week 4 return |
| Attribution and sources | Which channels start and finish journeys? | First touch vs last touch |
Most real questions use two or three of these together.
A worked example
A B2B software company wants to know why trials do not turn into paid accounts. The journey map says: sign up, set up a project, invite a teammate, pay.
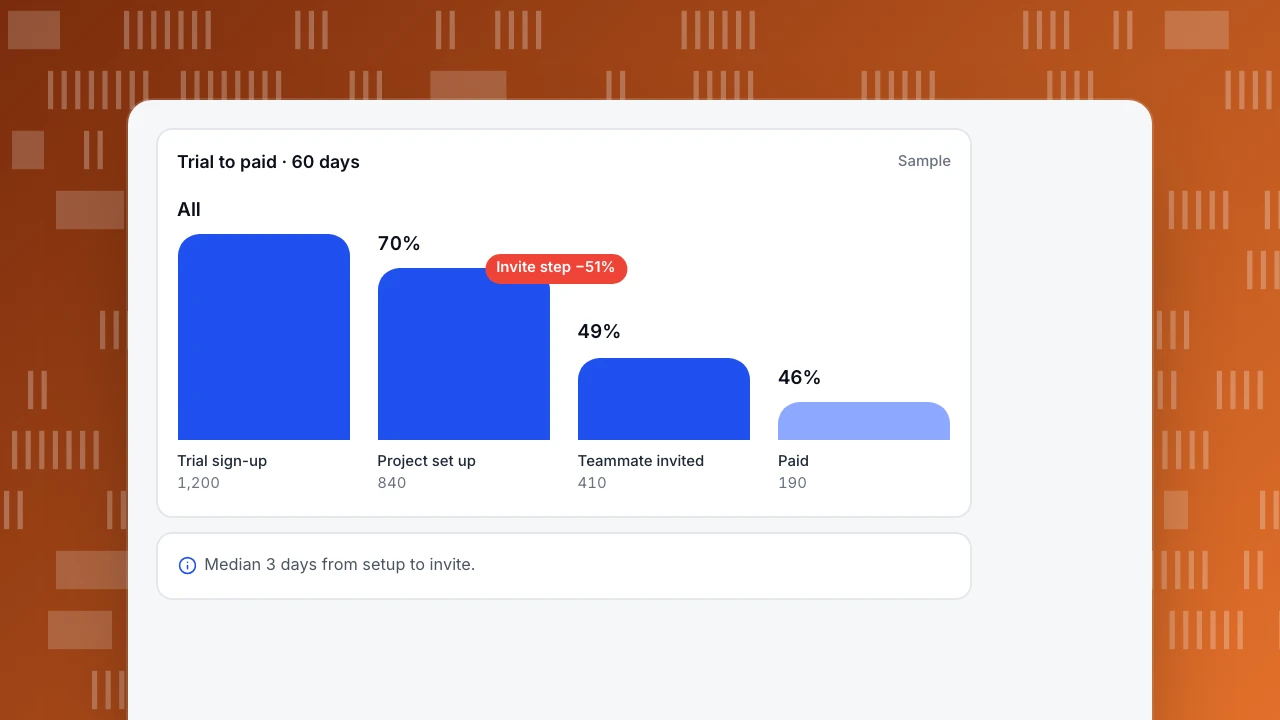
- Funnel. Of 1,200 trial sign-ups, 70% set up a project, but only 49% of those invite a teammate. That step loses the most.
- Paths after setup. A forward path from "project set up" shows the most common next step is the settings page, then leaving. People look for the invite option there and do not find it.
- Timelines. Opening a few timelines of people who set up but never invited confirms it: they visit settings two or three times over several days.
- Change and check. The team adds an invite prompt right after setup and compares the next weekly cohorts.
The finding came from combining analyses: the funnel showed where, paths showed what instead, timelines showed why.
Trial to paid · 60 days
SampleTrial sign-up
1,200
Project set up
840
Teammate invited
410
Paid
190
Making journeys measurable
- Track the key steps as events with clear names. See event tracking.
- Identify people at sign-in so visits on a phone and a laptop join into one journey.
- Keep source data such as UTM tags, so you can see which channels start journeys that finish.
- Write the expected journey down first, then check each step against data.
Common mistakes
- Treating the map as the result and never checking it.
- Reading only the funnel and guessing why people drop.
- Mixing anonymous and signed-in data, so journeys look shorter than they are.
FAQ
What is the difference between a journey map and journey analytics?
A map is a planned or imagined route, usually built in a workshop. Analytics measures the routes people actually take and shows where they differ from the map.
What data do I need?
Pageviews and events with timestamps, a way to recognise the same person across visits, and source information for the first visit.
Is customer journey analytics only for large companies?
No. A small team can answer most journey questions with a funnel, a path report and a look at a few timelines.
See also: Customer journey optimization, Mobile app customer journey.
Was this article helpful?
We use your answers to fix and expand this page.
Couldn’t send. Please try again in a minute.
Thanks for the feedback. We’ll use it to improve this page.You’ve already sent feedback on this page. Thanks.

Product Analyst
Focuses on event analysis, conversion funnels, and retention, using clear metric definitions and structured analysis to explain product performance.