Try it on your own data
Every report in this article is in the free plan. One snippet for web and apps, up to 10 sites.
Start freeCustomer data analytics combines profile, behaviour and purchase data to decide who to win, keep and grow. This guide lists the five questions it should answer and the data each needs, then works through RFM for a store with 5,000 buyers, ending in three campaigns.
What you will learn
- Solve identity first: visits, orders and tickets must point at one person
- Start from a decision you will act on this month, not from the data you have
- RFM turns order history into segments that map straight to campaigns
What customer data analytics is
Customer data analytics is the work of combining what you know about customers (who they are), what they do (visits, product use, support contacts) and what they buy (orders, subscriptions, refunds), and using it to decide who to acquire, who to keep and how to grow each relationship.
It differs from website analytics in its unit. Website analytics counts visits and pageviews; customer analytics counts people, over months or years, across devices and channels. That makes identity the first problem to solve: until visits, orders and support tickets point at the same person, every customer question is answered with partial data.
Five questions it should answer
Most useful customer analysis answers one of five questions. The table lists each one with the data it needs and a typical method. Start with the question you would act on this month, not with the data you happen to have.
| Question | Data it needs | Typical method |
|---|---|---|
| Who are our customers? | Profile, signup source, first order | Segments by source, country, plan |
| Who is worth the most? | Orders and refunds per person | LTV, RFM, revenue concentration |
| Who is slipping away? | Last order or last active date, usage trend | RFM recency, churn signals, cohorts |
| What brings them back? | Campaigns, visits and orders over time | Repeat-purchase rate by cohort and offer |
| What do they need next? | Purchase sequences, product use | Next-product analysis, feature adoption |
Start with the question you would act on this month.
The data you need, and how to join it
- Identity. A stable customer ID on every record: the account ID after login, or a hashed email for guest checkouts. In TapCub, people appear in the people list after \
tapcub.login\or a server-side bind, and one login ID is one person across web, app and mini program, with their earlier anonymous visits attached. - Orders. Every purchase with amount, date, items and refunds, ideally sent from the server so ad blockers and closed tabs do not lose them. See revenue tracking.
- Behaviour. Visits, key events and product use, so you can see what happened before a purchase or a cancellation.
- Profile. Plan, country, signup source, company size. Only what you will segment by.
Keep the join honest: if a third of orders are guest checkouts with no ID, say so on every report that uses them. A first-party data strategy is mostly about closing that gap.
A worked example: RFM for a store with 5,000 buyers
RFM scores each customer on recency (days since last order), frequency (number of orders) and monetary value (total spend), usually 1–5 each by quintile, and groups the combinations into named segments.
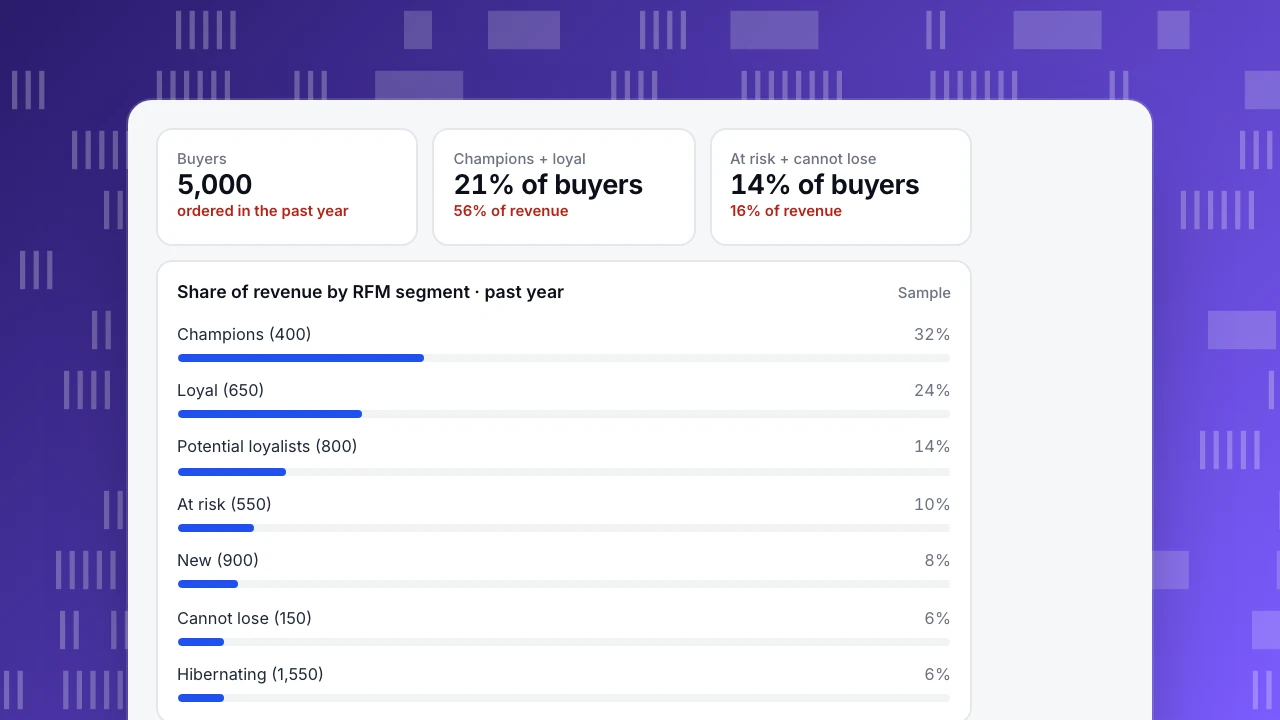
An online store runs RFM on its 5,000 customers who ordered in the past year. The chart shows each segment's share of revenue:
- Champions and loyal customers are 21% of buyers (1,050 people) and 56% of revenue. They need recognition and early access, not discounts.
- At risk and cannot lose are 14% of buyers but 16% of revenue: people who used to buy often and have gone quiet. They are the cheapest revenue to win back.
- Hibernating customers are 31% of buyers and 6% of revenue. A single low-cost reactivation email, then leave them alone.
Three campaigns came out of one table: a members' preview for champions and loyal customers, a personal win-back offer for the 700 at-risk and cannot-lose customers, and a cleanup of the hibernating list so the main newsletter goes to people who open it.
Buyers
5,000
ordered in the past year
Champions + loyal
21% of buyers
56% of revenue
At risk + cannot lose
14% of buyers
16% of revenue
Share of revenue by RFM segment · past year
SampleFrom analysis to action
- Name the decision before the query. "Which 700 customers get the win-back offer" is a decision; "understand our customers" is not.
- Turn the segment into a list someone can use. Export it, sync it to email, or filter the people list on it.
- Measure against a holdout. Keep 10% of each targeted segment out of the campaign, so you can tell whether the offer brought them back or they would have returned anyway.
- Re-run on a schedule. Segments move every month. TapCub's commerce RFM grid compares each segment with 30 days earlier and lists the largest moves, such as loyal customers sliding to at risk.
FAQ
What are the types of customer analytics?
Commonly descriptive (who your customers are and what they did), diagnostic (why something changed), predictive (who is likely to buy or churn) and prescriptive (what to do for each group). Most teams get the most value from good descriptive segments first.
What is the difference between customer analytics and customer data analytics?
They are used interchangeably. "Customer data analytics" stresses the data work (collecting, joining and cleaning customer records); "customer analytics" stresses the questions and decisions.
What data is used in customer analytics?
Identity, transactions, behaviour (web, app and product events), support and survey data, and profile attributes such as plan or country.
Is RFM still useful?
Yes, for any business with repeat purchases. It needs only order dates and amounts, is easy to explain, and the segments map directly to campaigns.
See also: Digital analytics, Product intelligence.
Was this article helpful?
We use your answers to fix and expand this page.
Couldn’t send. Please try again in a minute.
Thanks for the feedback. We’ll use it to improve this page.You’ve already sent feedback on this page. Thanks.

Data Engineer
Writes about event design, data quality, and collection workflows, with verifiable implementation methods for reliable analytics.