Try it on your own data
Every report in this article is in the free plan. One snippet for web and apps, up to 10 sites.
Start freeSplitting customers into groups is easy; the analysis is deciding which differences are worth acting on. This guide runs customer segmentation analysis in five steps: start from a decision, pick variables you can observe, compare segments on one KPI, check size and stability, then act and measure again.
What you will learn
- Start from the decision and the KPI, then choose segments
- Compare every segment on the same KPI with its size next to it
- Treat differences as hypotheses and test them with an action on part of the segment
What customer segmentation analysis is
Customer segmentation analysis splits customers into groups that behave differently and compares those groups to decide what to do for each. The splitting is the easy part. The analysis is in the comparison: which group converts, retains or spends differently, by how much, and whether the difference is large and stable enough to act on. (For the term itself, see segment.)
Most guides start with a list of segmentation models. This one starts with the decision, because the right segments depend on what you will do with them.
Step 1: start from a decision
Write the decision before choosing variables. Examples:
- Which customers should get a win-back email, and which would come back anyway?
- Which plan or channel should the onboarding redesign target first?
- Where should support time go: large accounts or new self-serve users?
Each decision names the KPI you will compare: reactivation rate, activation rate, revenue retained. If you cannot name the KPI, the segments will end up as a slide rather than an action.
Step 2: choose variables you can observe
Segmentation models differ mainly in where the data comes from. Demographic and psychographic segments need surveys or a CRM; behavioral and value segments come straight from event data, so they are usually where analysis starts. The table lists the common models with the data each needs.
Prefer one or two variables per split. Two variables with three levels each already give nine segments, and most will be too small to compare.
| Model | Example split | Data you need | From event data? |
|---|---|---|---|
| Behavioral | Used feature X vs not; purchase count | Events | ✓ Yes |
| Value (RFM) | Champions, at risk, hibernating | Transaction event with amount | ✓ Yes |
| Lifecycle | New, returning, dormant | First seen, last active | ✓ Yes |
| Acquisition | By first channel or campaign | UTM, referrer | ✓ Yes |
| Geographic | Country, region | IP-derived location | ~ Coarse |
| Firmographic (B2B) | Company size, industry | CRM or account traits | ~ If passed as traits |
| Demographic, psychographic | Age, attitudes | Surveys, CRM | ✗ No |
Start with the models your event data already supports.
Step 3: compare segments on one KPI
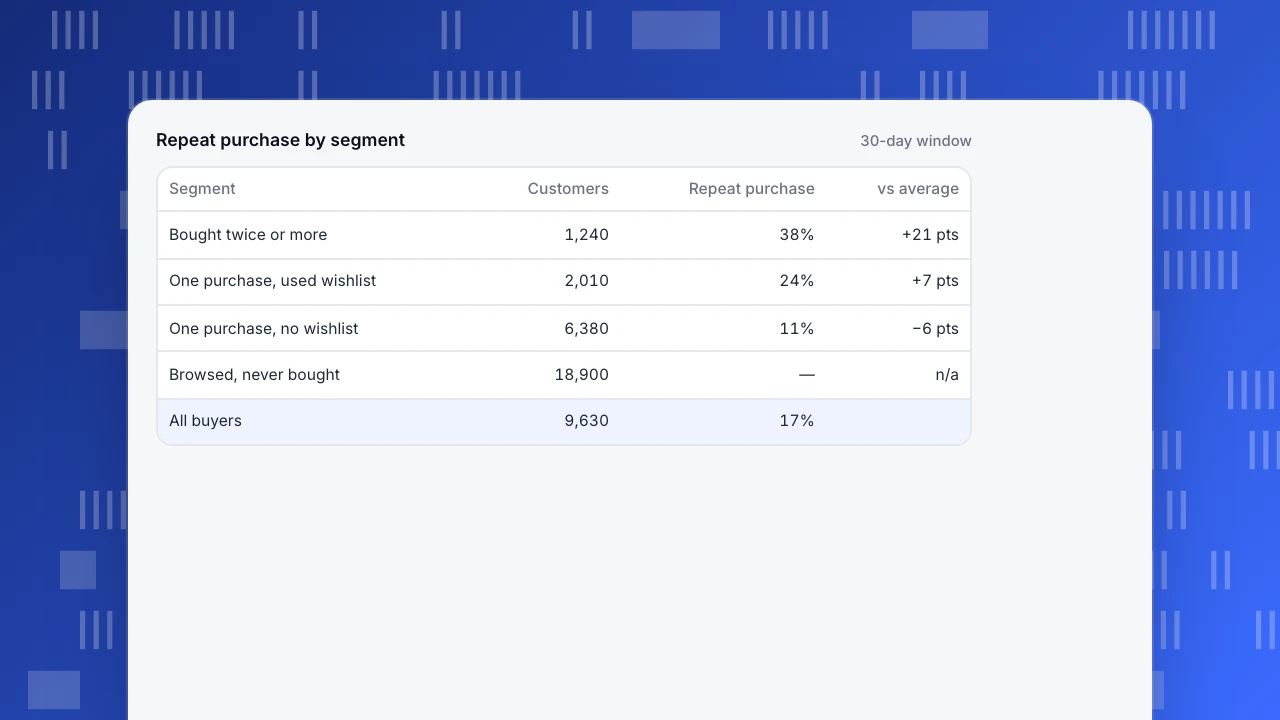
Put the segments side by side on the KPI from step 1, with size next to it. The example compares four behavioral segments of an online store on 30-day repeat purchase:
- Bought twice or more is small but repeats at more than twice the average. It is the group to protect.
- One purchase, used wishlist repeats well above one purchase, no wishlist, even though both bought once. The wishlist is a lead: test reminding the second group to save items.
- Browsed, never bought is the largest group but cannot repeat by definition, so it needs a different KPI (first purchase rate).
The comparison only means something when every segment is measured over the same window with the same definition. See retention metrics for choosing that definition.
Repeat purchase by segment
30-day window| Segment | Customers | Repeat purchase | vs average |
|---|---|---|---|
| Bought twice or more | 1,240 | 38% | +21 pts |
| One purchase, used wishlist | 2,010 | 24% | +7 pts |
| One purchase, no wishlist | 6,380 | 11% | −6 pts |
| Browsed, never bought | 18,900 | — | n/a |
| All buyers | 9,630 | 17% |
Step 4: check size and stability
Before acting, check three things:
- Size. A segment of 40 people can swing ten points from one month to the next. Note the count on every row.
- Stability. Recompute the comparison on the previous period. A difference that flips sign is noise.
- Cause vs selection. Wishlist users may repeat more because they were more engaged to begin with. Treat the difference as a hypothesis, then test it with an action on part of the segment.
Step 5: act and measure again
Each segment gets one action and one KPI. Run the action on part of the segment and keep the rest as a holdout where you can, then compare the KPI after a fixed period. Segments drift: customers move between them as they buy, lapse and come back, so rebuild them on a schedule rather than once. That is also the difference from a cohort, which is fixed at the moment people join.
Customer segmentation in TapCub
TapCub segments are built from behavior and properties. Rule segments (did or did not do an event, property, first seen, sequence, tag) refresh daily; RFM segments use a transaction event and an amount and map quintiles to 10 buckets such as champions, at risk and hibernating; live segments join at collect time; static segments come from an imported list. Identity can be person, device, visitor or account, and each segment keeps a 30-day size trend (segments).
Analyze applies a segment as a cohort in analysis, so the same funnel or retention chart can be compared across segments. For B2B, accounts group identified users by company and add a 0–100 health score (accounts). Anonymous visitors have no profile, so person-level segments only include identified users. For value-based splits, see RFM; for store use cases, the e-commerce page.
FAQ
What is customer segmentation analysis?
Splitting customers into groups that behave differently and comparing the groups on a KPI to decide what to do for each.
What are the main types of customer segmentation?
Demographic, geographic, psychographic, behavioral, value-based (such as RFM) and, for B2B, firmographic. Behavioral and value segments can be built directly from event data.
How many segments should I have?
As many as you can act on differently, and each large enough to compare. Three to six is common; dozens usually means the variables were combined too freely.
How is a segment different from a cohort?
A cohort is fixed by when people joined or first did something. A segment is defined by rules and people move in and out as their behavior changes.
How often should segments be refreshed?
Behavioral segments should refresh on a schedule (daily or weekly) so customers move between them as they act. Compare results over the same fixed windows.
See also: Pareto analysis.
Was this article helpful?
We use your answers to fix and expand this page.
Couldn’t send. Please try again in a minute.
Thanks for the feedback. We’ll use it to improve this page.You’ve already sent feedback on this page. Thanks.

Product Analyst
Focuses on event analysis, conversion funnels, and retention, using clear metric definitions and structured analysis to explain product performance.