Try it on your own data
Every report in this article is in the free plan. One snippet for web and apps, up to 10 sites.
Start freeMost problems and most results are concentrated in a few places; Pareto analysis measures exactly how concentrated. This guide gives the eight steps, works through 1,240 support tickets where four reasons produced 80% of the volume (and fixing them cut tickets 30%), shows a traffic example that is 68/20 rather than 80/20, and lists the mistakes to avoid.
What you will learn
- Sort categories by size and add a cumulative percentage
- The cut-off near 80% marks the vital few
- Report the real split; 80/20 is a rule of thumb
- Weight by impact when frequency is misleading
- Re-run after fixes; new causes move up
What is Pareto analysis?
Pareto analysis is a technique for finding the few causes that account for most of an effect, so you can focus effort where it pays off most. It is based on the Pareto principle, often called the 80/20 rule: in many systems, roughly 80% of outcomes come from about 20% of causes. 80% of support tickets may come from 20% of issue types, 80% of revenue from 20% of customers, 80% of traffic from 20% of pages.
The principle is named after the economist Vilfredo Pareto, who observed in the 1890s that about 80% of land in Italy was owned by 20% of the population. Quality pioneer Joseph Juran generalized it as "the vital few and the trivial many" and made it a standard quality-management tool.
The 80/20 split is a rule of thumb, not a law. Real data might show 70/20, 90/10 or 60/40. The point is that effects are usually concentrated, and the analysis tells you how much.
How to do a Pareto analysis, step by step
- Define the effect you want to reduce or grow: support tickets, checkout errors, churned accounts, revenue, sessions.
- Choose the categories that might explain it: ticket reason, error type, churn reason, customer, page, channel.
- Collect counts for a fixed period, using the same definition throughout.
- Sort categories from largest to smallest.
- Compute each category's share of the total and the cumulative share.
- Draw a Pareto chart: bars for each category in descending order, plus a line for the cumulative percentage.
- Find the cut-off where the cumulative line crosses about 80%. The categories to the left are your "vital few".
- Act on the vital few, then repeat the analysis after the change.
Worked example: support tickets
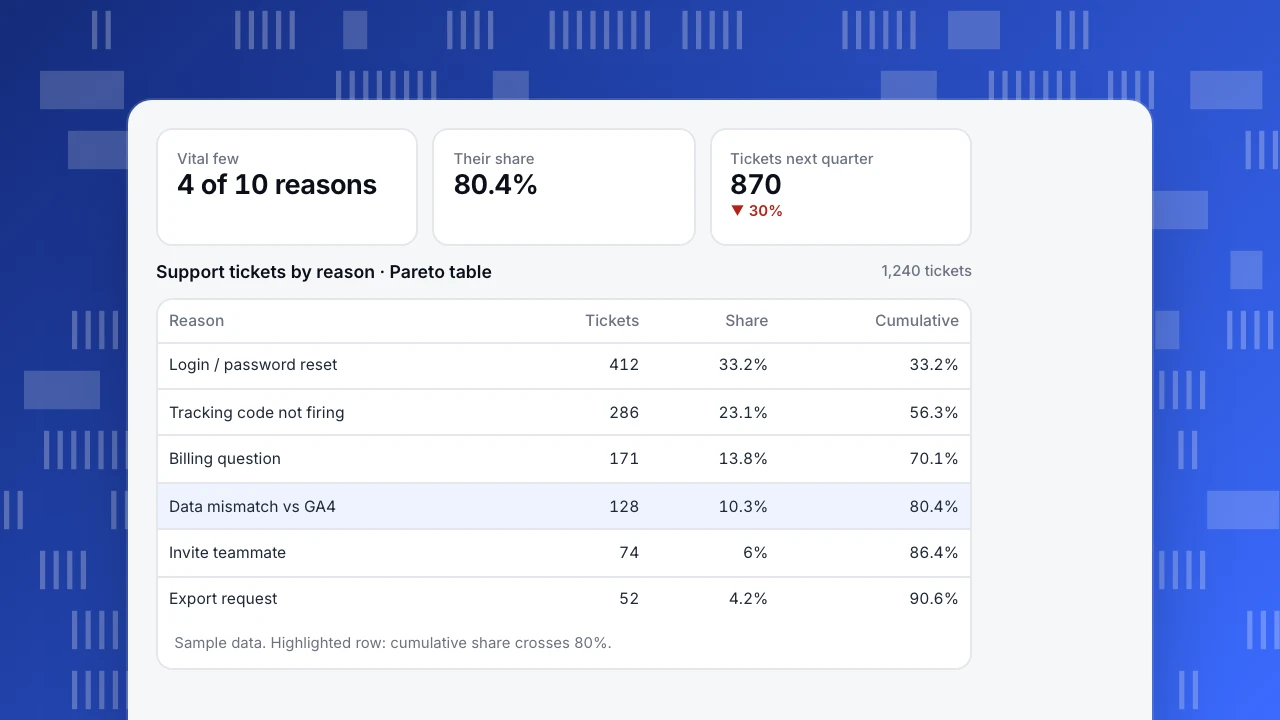
A SaaS analytics team tagged 1,240 support tickets from one quarter by reason (sample data):
| Reason | Tickets | Share | Cumulative |
|---|---|---|---|
| Login / password reset | 412 | 33.2% | 33.2% |
| Tracking code not firing | 286 | 23.1% | 56.3% |
| Billing question | 171 | 13.8% | 70.1% |
| Data mismatch vs GA4 | 128 | 10.3% | 80.4% |
| Invite teammate | 74 | 6% | 86.4% |
| Export request | 52 | 4.2% | 90.6% |
| Chart customization | 39 | 3.1% | 93.7% |
| Chat widget style | 27 | 2.2% | 95.9% |
| API rate limit | 18 | 1.5% | 97.3% |
| Other | 33 | 2.7% | 100% |
The vital few: four of ten reasons (40% of categories) produce 80.4% of tickets. Two alone, login problems and tracking code not firing, account for 56%.
What the team did:
- Login / password reset (412): added magic-link sign-in and clearer reset emails.
- Tracking code not firing (286): added an installation checker that tests the live page and explains the common causes (ad blockers, Content Security Policy, wrong site key).
- Billing (171) and GA4 mismatch (128): wrote two help articles and linked them from the billing page and the dashboard.
Next quarter, tickets fell to 870 (−30%) with the same customer base. The long tail (chart customization, widget style) did not change and did not need to.
Vital few
4 of 10 reasons
Their share
80.4%
Tickets next quarter
870
▼ 30%
Support tickets by reason · Pareto table
1,240 tickets| Reason | Tickets | Share | Cumulative |
|---|---|---|---|
| Login / password reset | 412 | 33.2% | 33.2% |
| Tracking code not firing | 286 | 23.1% | 56.3% |
| Billing question | 171 | 13.8% | 70.1% |
| Data mismatch vs GA4 | 128 | 10.3% | 80.4% |
| Invite teammate | 74 | 6% | 86.4% |
| Export request | 52 | 4.2% | 90.6% |
Sample data. Highlighted row: cumulative share crosses 80%.
A second example: traffic concentration
On a site with 40 landing pages and 50,000 monthly sessions (sample data), the top 8 pages (20%) bring 34,143 sessions, 68% of the total. That is not 80/20, and it does not need to be: it still says that improving conversion on 8 pages affects two-thirds of visitors, while rewriting the bottom 20 pages touches very few. It also flags risk: if the top page (27% of sessions alone) loses rankings, traffic drops sharply. See content performance metrics.
Where Pareto analysis works in analytics
| Effect | Categories | Typical finding |
|---|---|---|
| Revenue | Customers or accounts | A minority of customers drive most revenue; protect them (see RFM) |
| Traffic | Pages, channels, referrers | A few pages and one or two channels dominate |
| Conversion loss | Funnel steps, form fields | One step or field causes most drop-off; see funnel analysis mistakes |
| Errors | JavaScript errors, pages, browsers | A handful of errors produce most occurrences |
| Churn | Cancellation reasons | Two or three reasons explain most cancellations |
| Performance | Slow pages | A few templates cause most poor LCP experiences |
| Effect | Categories | Typical finding |
|---|---|---|
| Revenue | Customers | A minority drives most revenue |
| Traffic | Pages, channels | A few pages dominate |
| Conversion loss | Funnel steps | One step causes most drop-off |
| Errors | JS errors | A handful cause most occurrences |
| Churn | Cancellation reasons | Two or three reasons dominate |
Weight by revenue or cost when counts alone mislead.
Limitations and common mistakes
- Treating 80/20 as exact. Report the real split. A 60/40 distribution calls for broader action than a 90/10 one.
- Counting frequency, not impact. Ten "can't log in" tickets may matter less than one "charged twice". Weight categories by cost or revenue when you can.
- Poor categories. A big "Other" bar means the tagging is too coarse. If "Other" is in the top three, re-categorize first.
- Lumping different things together or splitting one cause across several labels changes the ranking.
- Static snapshots. Re-run after fixes. Once the top causes shrink, new ones move up.
- Ignoring the tail entirely. The trivial many can still hold a severe issue (a security report, a data loss bug).
Pareto analysis with TapCub data
Most TapCub reports already sort by volume: pages, sources, events, JavaScript errors and crawler 404s. Export or query them with SQL, add a cumulative-percentage column, and you have a Pareto table. For revenue concentration, run an RFM analysis; for error concentration, start with JavaScript errors sorted by occurrences; for the biggest funnel loss, use funnel drop-off.
See also: Analyze event distribution.
Sources
- ASQ. What is a Pareto chart?
- Juran, J. M. (1951). Quality Control Handbook. McGraw-Hill.
- Pareto, V. (1896). Cours d'économie politique. Lausanne.
Was this article helpful?
We use your answers to fix and expand this page.
Couldn’t send. Please try again in a minute.
Thanks for the feedback. We’ll use it to improve this page.You’ve already sent feedback on this page. Thanks.

Data Analyst
Explores traffic sources, conversion funnels, and retention, using clear metric definitions and concrete examples to explain what the numbers mean.