Try it on your own data
Every report in this article is in the free plan. One snippet for web and apps, up to 10 sites.
Start freeOne extreme value can make an average meaningless. This guide explains what outliers are in analytics data, compares four ways to detect them, works through 12 orders with the IQR rule and z-scores, and shows how to decide whether an outlier is an error or a real value worth reporting.
What you will learn
- The IQR rule (1.5 × IQR beyond the quartiles) is robust; z-scores can miss outliers in small samples
- Report the median or percentiles next to the mean whenever a few values are extreme
- Remove errors, but keep real outliers and segment, cap or report them openly
What an outlier is
An outlier is a value that lies far from most of the other values. It may be an error (a bot, a test order, a typo, a broken timer) or a real but rare event (a bulk order, a viral day, one very active customer). The method finds candidates; deciding which kind it is takes judgment.
Common outliers in analytics data
- Session duration: a tab left open overnight records a 9-hour session.
- Order value: one wholesale order is 30 times the usual basket.
- Traffic: a bot or a news mention multiplies one day's visits.
- Events per user: a script or a power user fires thousands of events.
Averages are the first casualty: one extreme value can pull the mean far from what a typical case looks like. See mean vs median.
Detection methods
The table below compares the four common methods.
| Method | How it works | Strength | Weakness |
|---|---|---|---|
| IQR rule | Flag values beyond Q1 − 1.5 × IQR or Q3 + 1.5 × IQR | Robust; not distorted by the outlier | Flags many values in skewed data |
| Z-score | Flag values more than 3 standard deviations from the mean | Simple; good for large, roughly normal data | The outlier inflates the standard deviation |
| Percentiles | Flag the top or bottom 1% or 5% | Easy to explain; works for skewed data | Always flags something, even with no outliers |
| Business rules | Flag impossible or suspicious values | Uses domain knowledge | Needs maintenance |
Use a statistical method to find candidates and a business rule to decide.
A worked example: 12 orders
Order values for one day (sample numbers), sorted:
$22, $25, $28, $30, $31, $34, $36, $38, $41, $45, $52, $960
IQR rule:
- Lower half: $22–$34, so Q1 = ($28 + $30) ÷ 2 = $29
- Upper half: $36–$960, so Q3 = ($41 + $45) ÷ 2 = $43
- IQR = $43 − $29 = $14
- Upper fence = Q3 + 1.5 × IQR = $43 + $21 = $64; lower fence = $29 − $21 = $8
- $960 is above $64: outlier. Every other order is inside the fences.
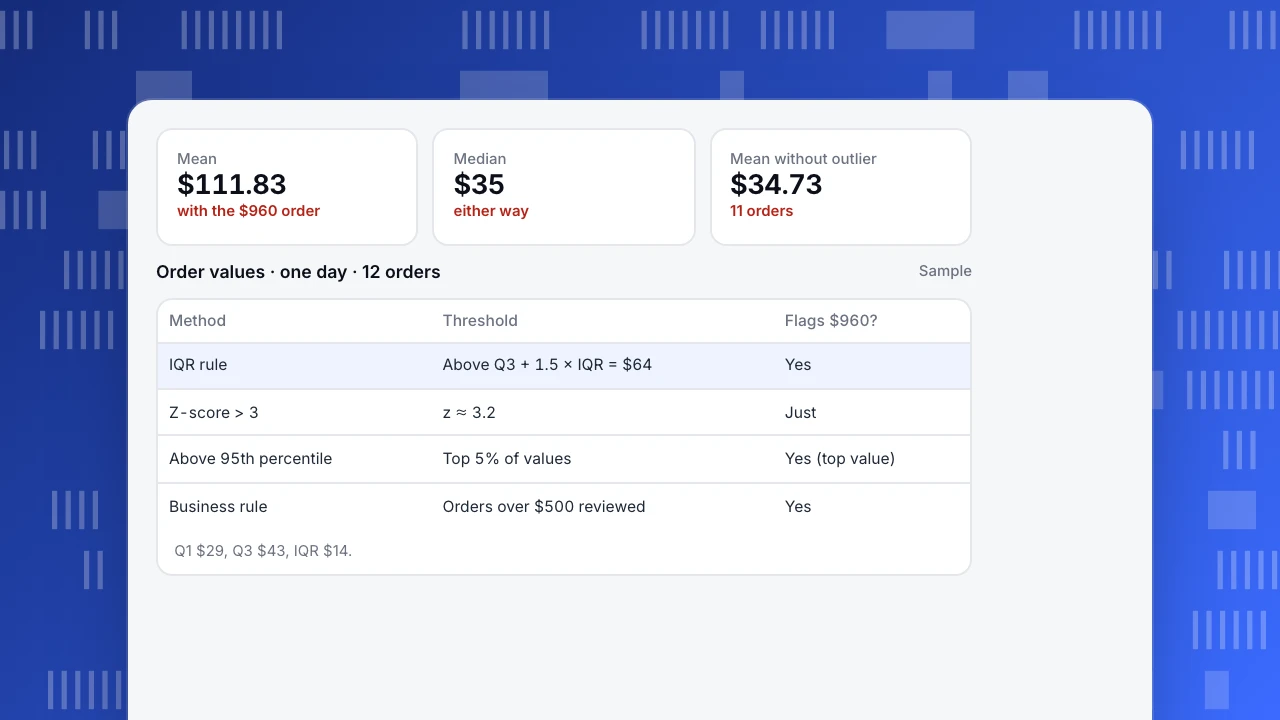
Z-score: the mean is $111.83 and the sample standard deviation about $267. The z-score of $960 is (960 − 111.83) ÷ 267 ≈ 3.2, only just past the usual cut-off of 3. The outlier inflates the standard deviation it is measured against, so in small samples z-scores often miss outliers. With 12 values, no z-score can exceed about 3.2 at all.
Effect on summaries:
- Mean with the outlier: $111.83
- Mean without it: $34.73
- Median (either way): $35
The median barely notices the $960 order; the mean triples.
Mean
$111.83
with the $960 order
Median
$35
either way
Mean without outlier
$34.73
11 orders
Order values · one day · 12 orders
Sample| Method | Threshold | Flags $960? |
|---|---|---|
| IQR rule | Above Q3 + 1.5 × IQR = $64 | Yes |
| Z-score > 3 | z ≈ 3.2 | Just |
| Above 95th percentile | Top 5% of values | Yes (top value) |
| Business rule | Orders over $500 reviewed | Yes |
Q1 $29, Q3 $43, IQR $14.
Error or real?
Ask, in this order:
- Is it possible? A negative price or a 30-hour session in a 24-hour day is an error. Fix or remove it.
- Is it a known artefact? Bots, tests, duplicates, open tabs. Remove it during cleaning; see data cleaning techniques.
- Is it real? Check the source: the $960 order is a café ordering supplies in bulk. It is real.
- What question are you answering? For "typical basket size", report the median, or the mean without wholesale orders. For "revenue", the $960 counts in full.
Options for real outliers:
- Keep and report the median or percentiles alongside the mean.
- Segment: report wholesale and retail separately.
- Cap (winsorise): replace values above a percentile with that percentile; see winsorization.
- Remove only with a written rule, applied the same way every time.
Seeing distributions in TapCub
In All-platform analytics › Behavior › Behavior analysis, numeric measures can be aggregated as average, median or 90th percentile, so you can put the median next to the mean for order value or session length; the distribution model shows how values spread across buckets. For outliers over time, a monitor with the anomaly condition alerts when a metric moves far outside its usual range. Related: standard deviation vs standard error, percentile and anomaly detection.
See also: Interquartile range (IQR), Scatter plot.
Was this article helpful?
We use your answers to fix and expand this page.
Couldn’t send. Please try again in a minute.
Thanks for the feedback. We’ll use it to improve this page.You’ve already sent feedback on this page. Thanks.

Data Analyst
Explores traffic sources, conversion funnels, and retention, using clear metric definitions and concrete examples to explain what the numbers mean.