Try it on your own data
Every report in this article is in the free plan. One snippet for web and apps, up to 10 sites.
Start freeStandard deviation and standard error look alike and are often swapped in reports. This guide explains what each measures, works through an order-value sample at three sample sizes and a conversion-rate example, and lists the mistakes to avoid.
What you will learn
- Standard deviation describes how varied the values are; standard error describes how precise the average is
- SE = SD ÷ √n: four times the data halves the standard error, but the SD stays the same
- Use SD to describe customers, SE or a confidence interval for error bars on an average
The difference in one sentence
Standard deviation (SD) tells you how spread out the individual values are. Standard error (SE) tells you how precisely you have estimated the average.
SD is a property of the data. SE is a property of your estimate, and it shrinks as you collect more data. If someone asks "how different are our customers?", you want the SD. If they ask "how sure are we about the average?", you want the SE.
The formulas
SD = √( Σ(x − mean)² ÷ (n − 1) )
SE of the mean = SD ÷ √n
SE of a proportion = √( p × (1 − p) ÷ n )
The key part is √n. To halve the standard error you need four times as many observations. The SD does not depend on n in that way: more data just gives you a better estimate of the same spread.
A worked example: average order value
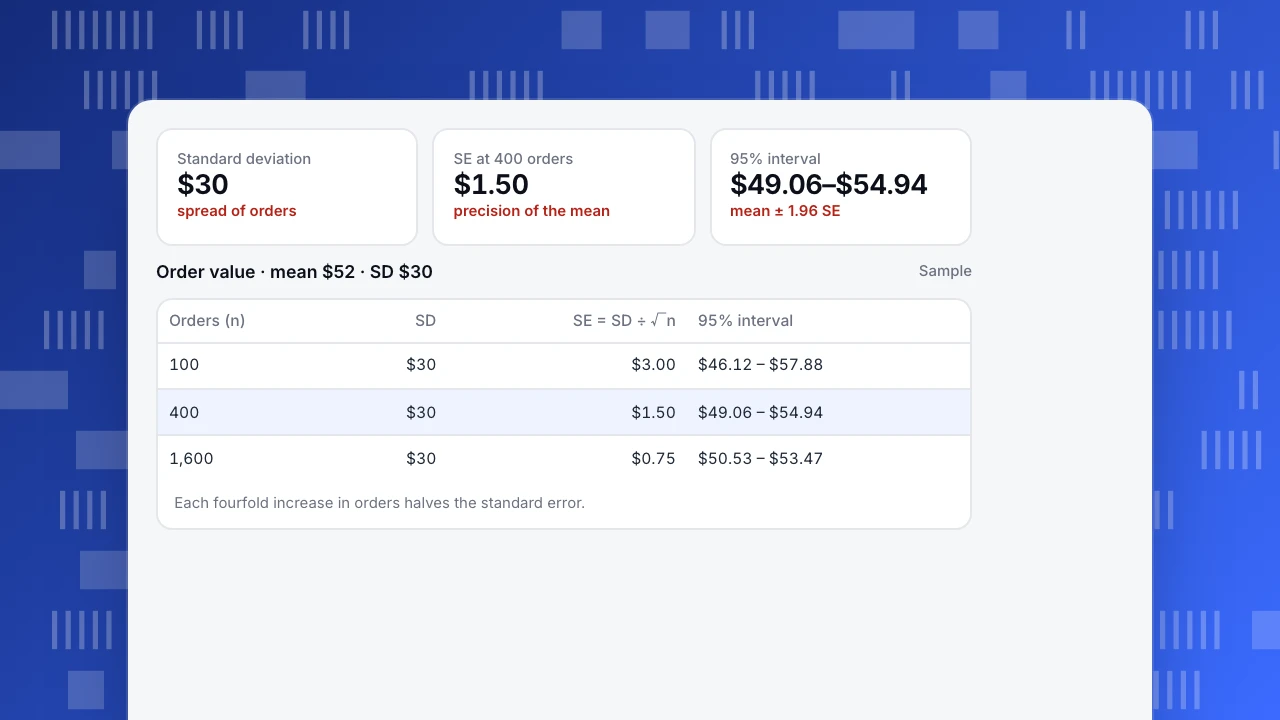
A store's orders have a mean of $52 and a standard deviation of $30 (sample numbers). Here is what happens to the standard error as the number of orders grows:
- 100 orders: SE = 30 ÷ 10 = $3.00. A 95% confidence interval is $52 ± $5.88, so $46.12 to $57.88.
- 400 orders: SE = 30 ÷ 20 = $1.50, interval $49.06 to $54.94.
- 1,600 orders: SE = 30 ÷ 40 = $0.75, interval $50.53 to $53.47.
The SD stays near $30 throughout: individual customers are just as varied. What improves is how sure you can be about the average.
Standard deviation
$30
spread of orders
SE at 400 orders
$1.50
precision of the mean
95% interval
$49.06–$54.94
mean ± 1.96 SE
Order value · mean $52 · SD $30
Sample| Orders (n) | SD | SE = SD ÷ √n | 95% interval |
|---|---|---|---|
| 100 | $30 | $3.00 | $46.12 – $57.88 |
| 400 | $30 | $1.50 | $49.06 – $54.94 |
| 1,600 | $30 | $0.75 | $50.53 – $53.47 |
Each fourfold increase in orders halves the standard error.
The conversion-rate version
For a rate, the spread comes from the rate itself. With a 4% conversion rate on 2,500 visitors:
- SE = √(0.04 × 0.96 ÷ 2,500) ≈ 0.0039, or 0.39 percentage points
- 95% interval: 4% ± 0.77 points, so about 3.23% to 4.77%
That is why a change from 4.0% to 4.3% on 2,500 visitors is well inside the noise. See statistical significance.
Side by side
The table below summarises when each one is the right number to report.
| Standard deviation | Standard error | |
|---|---|---|
| Describes | Spread of individual values | Precision of an estimate (mean or rate) |
| Changes with more data? | No, it settles at the true spread | Yes, falls with √n |
| Formula | √(Σ(x − mean)² ÷ (n − 1)) | SD ÷ √n; for a rate √(p(1 − p) ÷ n) |
| Use it for | "How varied are our customers?" | Error bars, confidence intervals, tests |
| Typical label | Mean ± SD | Mean ± SE, or 95% CI |
Label error bars every time: ±SD and ±SE can differ by a factor of ten or more.
Common mistakes
- Using SE to describe customers. "Order value $52 ± $1.50" makes customers look far more alike than they are. Use the SD to describe variety.
- Using SD for error bars on a mean. Bars that show ±SD look huge and hide real differences between averages. Use SE or a confidence interval, and say which.
- Not saying which one you plotted. Always label error bars.
- Forgetting skew. For long-tailed data like order value, the mean and SD can mislead; see mean vs median. With large samples the SE of the mean is still reasonable, but outliers make it unstable.
- Ignoring how data was sampled. The formulas assume independent observations. Repeated sessions from the same visitor are not independent; see data sampling.
Getting the inputs from TapCub
For a rate, all you need is the count and the denominator: conversions and visitors from Web analytics › Goals, or the step counts of a funnel in All-platform analytics. For a mean, open All-platform analytics › Behavior › Behavior analysis, pick a property such as order amount and use the average aggregation; for the standard deviation, use the per-order values from your order system or data warehouse. Then apply the formulas above, or compare groups with a p-value.
Was this article helpful?
We use your answers to fix and expand this page.
Couldn’t send. Please try again in a minute.
Thanks for the feedback. We’ll use it to improve this page.You’ve already sent feedback on this page. Thanks.

Product Analyst
Focuses on event analysis, conversion funnels, and retention, using clear metric definitions and structured analysis to explain product performance.