Try it on your own data
Every report in this article is in the free plan. One snippet for web and apps, up to 10 sites.
Start freeData sampling means looking at part of the data to estimate the whole. Done well, it gives fast answers that are close enough. Done carelessly, a small segment or a rare event can look twice as big or small as it really is. This guide covers the main sampling methods, where analytics tools sample, and how to tell when a sampled number is safe to use.
What you will learn
- Sampling estimates the whole from a part; error grows as the counted group gets smaller
- Large totals survive sampling well; small segments and rare events do not
- Know where your tool samples: at collection, at query time or only in specific features
What data sampling is
Sampling means working with part of a dataset to estimate a value for the whole. Surveys sample people; analytics tools may sample events or sessions to keep storage or queries fast.
A sample is useful when it is large enough and picked fairly. It misleads when the part you look at is small, or when the way it was picked is related to what you measure.
Sampling methods
The table lists the common methods. For behaviour data, sampling whole sessions or visitors (a form of cluster sampling) keeps journeys intact, so funnels and paths still make sense.
| Method | How it picks | Good for |
|---|---|---|
| Simple random | Every record has the same chance | General estimates on large data |
| Systematic | Every nth record | Streams such as 1 in 10 events |
| Stratified | Random within groups, such as each country | Making sure small groups are represented |
| Cluster | Whole groups, such as all events of a session | Keeping sessions or visitors intact |
| Convenience | Whatever is easiest to get | Quick checks only; prone to bias |
For behaviour data, sampling by session or visitor keeps journeys whole.
Where analytics tools sample
Sampling can happen at three points:
- At collection. Only part of the traffic is recorded. This saves storage, but the dropped data is gone for good.
- At query time. The data is stored in full, but a report reads a subset to answer faster.
- In specific features. Recording every session or every click is expensive, so features like session replay or autocapture often have their own rate.
In TapCub, session replay records 10% of sessions by default and autocapture has its own sample rate, both set by you. The collector also has a spike brake: if a minute has more than 1,000 events and more than 10 times the same hour's average over the past 7 days, it keeps about 1 in 10 events for roughly 10 minutes. That protects the pipeline during floods; it is not a standing sample.
A worked example
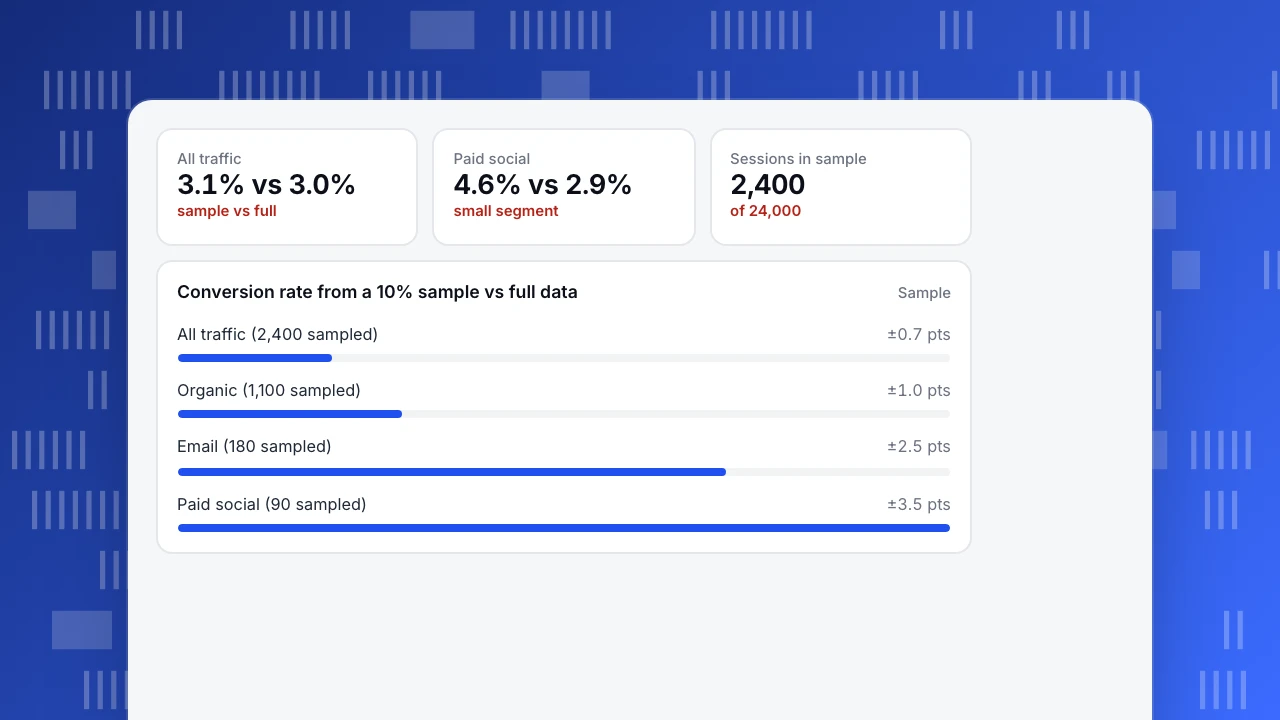
A report built from a 10% sample shows a 3.1% conversion rate for all traffic, against 3.0% on full data. Close enough. But paid social shows 4.6% in the sample and 2.9% on full data. The sample contained only 90 paid social sessions, so one or two extra conversions moved the rate by more than a point.
The chart shows the rough margin of error for each group at a 3% rate: under one point for the large groups, about three and a half points for the smallest.
All traffic
3.1% vs 3.0%
sample vs full
Paid social
4.6% vs 2.9%
small segment
Sessions in sample
2,400
of 24,000
Conversion rate from a 10% sample vs full data
SampleWhen to trust sampled numbers
- Large totals: usually fine.
- Small segments: check how many sessions or conversions the sample actually contains. Under a few hundred sessions, treat the number as a rough range.
- Rare events: a sample can miss them entirely or overstate them.
- Comparisons: a difference between two sampled groups needs a significance check.
- Decisions with money attached: rerun on full data first.
FAQ
What is data sampling in simple terms?
Looking at part of the data to estimate something about all of it.
Is sampled data accurate?
For large groups it is usually close. For small groups and rare events the error can be large.
How can I tell if a report is sampled?
Most tools mark sampled reports, often with an icon or a note on the share of data used. If unsure, check the tool's documentation for where it samples.
Related: statistical significance and data latency.
Was this article helpful?
We use your answers to fix and expand this page.
Couldn’t send. Please try again in a minute.
Thanks for the feedback. We’ll use it to improve this page.You’ve already sent feedback on this page. Thanks.

Technical Engineer
Focuses on tracking code, SDKs, and API integrations, with practical guidance on implementation checks and troubleshooting.