Try it on your own data
Every report in this article is in the free plan. One snippet for web and apps, up to 10 sites.
Start freeData quality is how far data can be trusted for the decision you want to make with it. This guide applies the six standard dimensions to web and product analytics, shows where analytics data usually goes wrong, and gives a weekly check list with sample results.
What you will learn
- Judge data quality against a decision: good enough to decide, not perfect
- Use the six dimensions to turn "numbers look wrong" into a specific check
- Run a weekly check list and compare totals with the source system
Data quality, defined
Data quality is how well data fits the job you want to use it for. Good-quality data is correct, complete enough, consistent across sources, available when you need it, in the format you expect, and counted once. Poor-quality data is any of those failing badly enough to change a decision.
That last part matters. No analytics data is perfect: some visitors block scripts, some sessions are cut short, some bots get through. The question is not "is it perfect" but "is it good enough to decide this". A 3% gap in visitor counts does not matter for a content plan; a doubled purchase event matters a lot for revenue reporting.
The six dimensions, applied to analytics
Data-management texts usually list six dimensions. Each one has a typical failure in web and product analytics, shown in the table.
The dimensions help because they turn a vague "the numbers look wrong" into a specific question you can check. "Revenue is 40% higher than in the billing system" is an accuracy or uniqueness problem; look for duplicate purchase events. "Sign-ups dropped to zero on Tuesday" is completeness; look at what was deployed on Tuesday.
| Dimension | Question | Typical analytics failure |
|---|---|---|
| Accuracy | Does it match reality? | Revenue event fires on page reload; order totals higher than billing |
| Completeness | Is anything missing? | Tag missing on checkout template; required property empty on 30% of events |
| Consistency | Do sources and names agree? | signup and sign_up for the same action; web and app use different names |
| Timeliness | Is it there when needed? | Server events arrive hours late; yesterday not processed by the morning meeting |
| Validity | Is it in the expected format? | Price sent as "19,90" text; country as free text |
| Uniqueness | Is everything counted once? | Script on the page twice; purchase sent from both browser and server |
One dimension per row; most real problems show up in two at once.
Where analytics data goes wrong
Most data-quality problems in analytics come from five places:
- Installation. The tag is on some templates but not others, or on the page twice. Checkout pages on a hosted platform are a common gap.
- Releases. A redesign renames a button or removes the element a click rule depended on, and an event quietly stops.
- Naming drift. Two teams track the same action as \
signup\and \sign_up\. Both are correct; the total is wrong. A tracking plan prevents this. - Traffic you did not want. Bots, referral spam, your own team and test environments.
- Definitions. Two tools with different session timeouts, timezones or bot rules will never agree. That is not a quality failure as long as you know the definitions.
A weekly data-quality check list
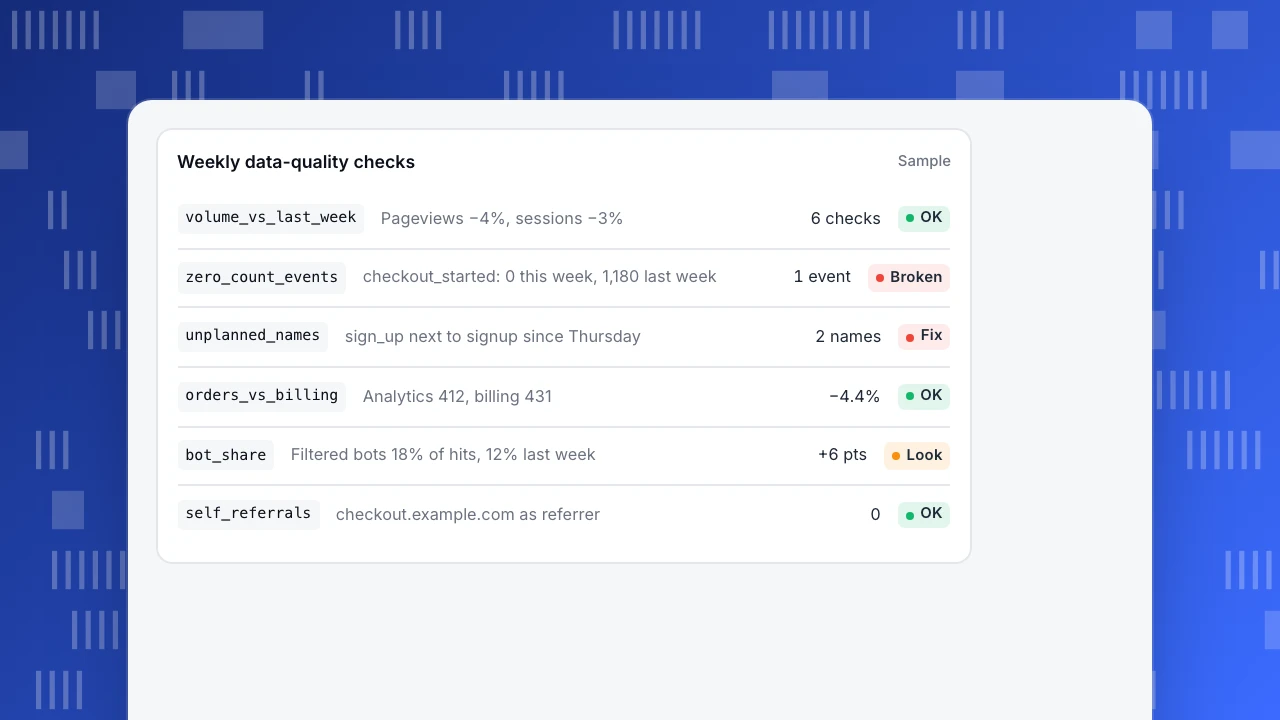
Ten minutes a week catches most problems before anyone builds a report on them. The sample shows one week's run on a typical marketing site: two checks failed and one needs a look.
- Volume against last week, per platform and per key event. A drop of more than a third with no campaign change usually means a tracking break.
- Zero-count events. Any event that fired last week and not this week.
- New, unplanned event names. Anything not in the tracking plan. In TapCub, new names land in the event inbox for review, and see what to do with unplanned events.
- Totals against the source system. Orders and revenue against billing; sign-ups against the user table. Expect a small gap, investigate a large one.
- Bot and internal share. A sudden rise in bot share or in traffic from your office network. See how to exclude internal traffic.
- Self-referrals and "(direct)" spikes. Often a sign of a missing tag on a domain or a redirect that drops the referrer.
Weekly data-quality checks
Samplevolume_vs_last_weekPageviews −4%, sessions −3%6 checksOKzero_count_eventscheckout_started: 0 this week, 1,180 last week1 eventBrokenunplanned_namessign_up next to signup since Thursday2 namesFixorders_vs_billingAnalytics 412, billing 431−4.4%OKbot_shareFiltered bots 18% of hits, 12% last week+6 ptsLookself_referralscheckout.example.com as referrer0OK
What a tool can check for you
Several checks can run without anyone looking. In TapCub:
- A second copy of the script on the same page is ignored, and the collector drops an identical event from the same visitor on the same path within one second, so double tags and double clicks do not double counts.
- A collection gap monitor alerts when no data arrives for longer than the minutes you set, which catches a broken tag within the hour. A period-change monitor on a key event catches a release that removed it.
- Event definitions can hide or block names you do not want, so a mistaken event does not keep polluting reports.
- Bots and AI crawlers are filtered out of visitor counts and reported separately.
None of this replaces comparing totals with the source system. Analytics is for behaviour; billing is for money.
FAQ
What are the six dimensions of data quality?
Accuracy, completeness, consistency, timeliness, validity and uniqueness. Some frameworks add integrity or relevance, but those six cover most practical checks.
How do you measure data quality?
Pick a check per dimension and track the result over time: the share of events with required properties (completeness), the gap against billing (accuracy), the number of duplicate IDs (uniqueness). A check you never run is not a measurement.
Why do two analytics tools show different numbers?
Different identifiers, session rules, bot filters, timezones and script blocking. Compare trends, not totals, and read both tools' definitions. See why visitor counts never match.
Who owns data quality?
Whoever owns the decision the data feeds, with help from whoever owns the tracking code. In small teams that is usually one marketer and one developer; write down who checks what.
Was this article helpful?
We use your answers to fix and expand this page.
Couldn’t send. Please try again in a minute.
Thanks for the feedback. We’ll use it to improve this page.You’ve already sent feedback on this page. Thanks.

Technical Engineer
Focuses on tracking code, SDKs, and API integrations, with practical guidance on implementation checks and troubleshooting.