Try it on your own data
Every report in this article is in the free plan. One snippet for web and apps, up to 10 sites.
Start freeData democratization means people across a company can find and use the data they need without waiting for an analyst. Done well, decisions get faster. Done badly, five teams quote five versions of the same number. This guide explains what it takes in practice, with five steps, a sample role setup and the risks to watch.
What you will learn
- Agree on metric definitions before opening access
- Give each role the least access it needs: read for most, edit for a few
- Share curated dashboards and read-only links rather than raw data
What data democratization means
Data democratization is making data available to the people who need it, in a form they can understand, without a gatekeeper for every question. It is not giving everyone access to everything. It is giving each person the right view, with shared definitions, so their answers match.
Why it goes wrong
- Different definitions. Marketing counts a sign-up when the form is sent; product counts it when the email is confirmed. Both are "sign-ups".
- Too much raw data. People without context draw confident conclusions from small or biased samples.
- No owner. Dashboards multiply, nobody maintains them, and stale ones keep being quoted.
Five steps that work
- Write the definitions down. A short glossary of your key metrics, with the event behind each. Keep it in a tracking plan.
- Set roles. Most people only need to read. A few build analyses. Very few change settings.
- Build one dashboard per team. Curated, owned by someone, with a text block that explains each chart.
- Share read-only views outside the team. A link for an agency or the board shows what you choose and nothing more.
- Review monthly. Remove dashboards nobody opens, check definitions still match the tracking.
Roles in practice
The table shows a sample setup for a 40-person company. In TapCub, roles are Owner, Admin, Analyst, Viewer and Agent only. Saving analyses needs Analyst or above, and only an admin or the owner can turn sharing on. Shared dashboards are read-only links that can have a password and show at most the last 90 days.
| Role | Who | Can do |
|---|---|---|
| Owner | Founder or data lead | Everything, including billing and deleting data |
| Admin | Ops or data engineer | Settings, tracking, sharing switches |
| Analyst | Marketers, product managers | Build and save analyses and dashboards |
| Viewer | Sales, support, leadership | Read reports and dashboards |
| Public link | Partners, agencies, board | Read one shared view, optionally with a password |
Sample setup for a 40-person company using TapCub roles.
A worked example
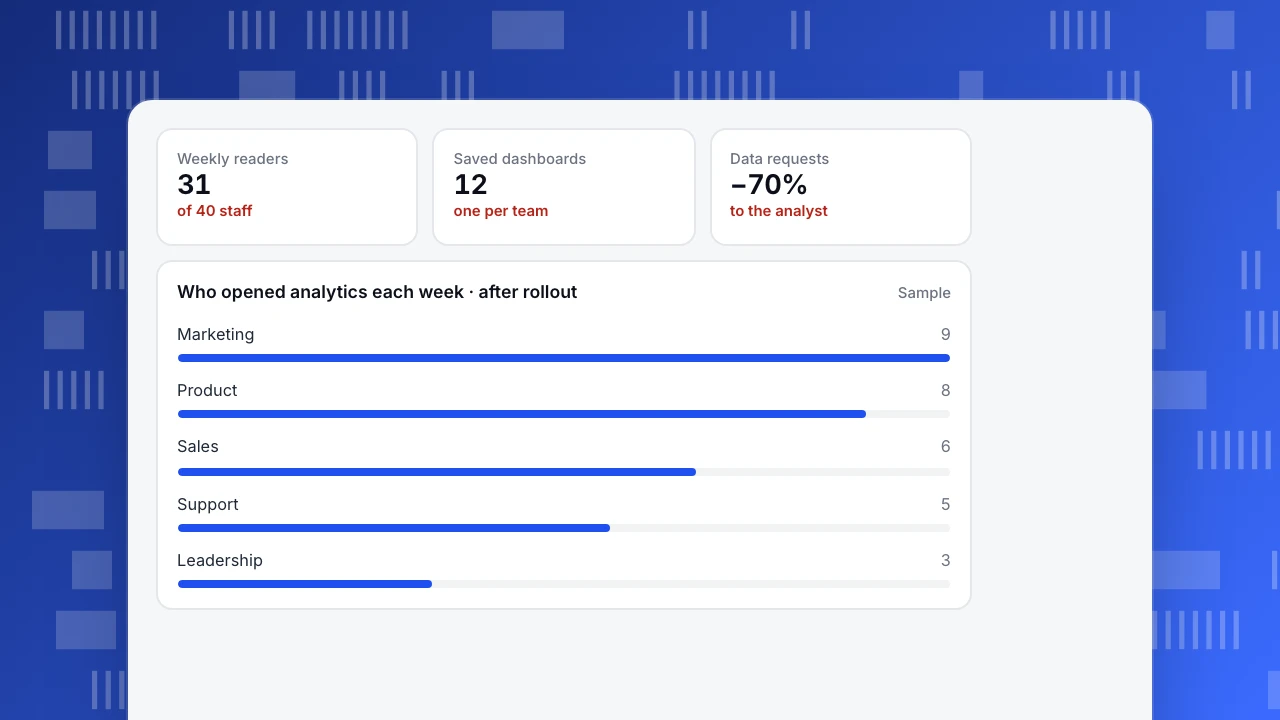
A company where one analyst answered every data question set up team dashboards with agreed definitions and gave most staff the Viewer role. After a month, 31 of 40 people opened analytics each week and requests to the analyst fell by about 70%. The analyst moved to deeper work, like retention analysis, instead of pulling weekly numbers.
Weekly readers
31
of 40 staff
Saved dashboards
12
one per team
Data requests
−70%
to the analyst
Who opened analytics each week · after rollout
SampleSigns it is working
- Meetings start from the same number.
- Questions to the data team shift from "what is the number" to "why did it change".
- People can find a definition without asking.
For keeping the underlying data trustworthy, see data quality.
FAQ
What is an example of data democratization?
A support lead checking which help pages are visited most, without filing a request, using a dashboard built for the support team.
Is data democratization a security risk?
It can be if access is broad and unmanaged. Use roles, share read-only views and keep personal data out of shared reports.
What is the difference between data democratization and self-service analytics?
Self-service analytics is the tooling that lets people answer their own questions. Democratization is the wider practice, including definitions, access and habits.
See also: Data maturity model.
Was this article helpful?
We use your answers to fix and expand this page.
Couldn’t send. Please try again in a minute.
Thanks for the feedback. We’ll use it to improve this page.You’ve already sent feedback on this page. Thanks.

Product Experience Specialist
Writes about product experience, practical workflows, and growth, turning complex processes into clear steps for everyday decisions.