Try it on your own data
Every report in this article is in the free plan. One snippet for web and apps, up to 10 sites.
Start freeMaturity models are useful only if they tell you what to fix next. This guide lays out five stages and their bottlenecks, scores six dimensions separately, and walks through a self-assessment where the average said "stage 2" but the real finding was that tools (3) had outrun governance (1), which changes the plan completely.
What you will learn
- Maturity runs from ad hoc to reporting, self-serve, predictive, embedded
- Stages are cumulative; tools cannot skip foundations
- Score each dimension separately to find the weakest link
- Fix governance and quality before adding tools
- Re-assess with the same group and questions
What is a data maturity model?
A data maturity model describes the stages an organization goes through as it gets better at collecting, managing and using data, from scattered spreadsheets to data that shapes everyday decisions and products. It gives you a shared vocabulary for where you are today, a way to spot the weakest link, and a sequence for what to improve next.
Many versions exist: Davenport and Harris's five stages of analytical competition, Gartner's analytics maturity levels, TDWI's assessment and the CMMI Institute's data management maturity model. They differ in naming but agree on the direction: from ad hoc to systematic to embedded.
The five stages
| Stage | What it looks like | Typical questions answered | Main bottleneck |
|---|---|---|---|
| 1. Ad hoc | Data in spreadsheets and tool defaults; numbers argued over in meetings | "How many visitors did we have?" | No reliable collection |
| 2. Reporting | Regular dashboards and KPI reports, built by a few people | "What happened last month?" (descriptive) | Definitions differ between teams |
| 3. Self-serve | Shared definitions; teams explore data themselves | "Why did it happen? Which segment?" (diagnostic) | Skills and governance |
| 4. Predictive and experimental | Forecasts, propensity models, controlled experiments | "What will happen? What works?" | Data science capacity, clean history |
| 5. Embedded | Data in products and daily decisions; feedback loops automated | "What should we do, automatically?" (prescriptive) | Culture and ethics at scale |
Stages are cumulative: a company with machine learning models but no agreed definition of "active user" is not at stage 4, it is at stage 2 with expensive tools.
| Stage | Questions answered | Bottleneck |
|---|---|---|
| 1 Ad hoc | How many? | Collection |
| 2 Reporting | What happened? | Definitions |
| 3 Self-serve | Why? Which segment? | Skills, governance |
| 4 Predictive | What will happen? | Data science, history |
| 5 Embedded | What should we do? | Culture at scale |
Stages are cumulative.
The six dimensions to assess
Maturity is uneven, so score each dimension separately:
- Strategy and goals: is there a data strategy tied to business goals?
- Collection and quality: is there a tracking plan, and are data issues caught before they reach reports?
- Tools and architecture: can data flow from sources to the people who need it?
- Skills: how many people can answer their own questions?
- Governance: are there owners, definitions, access rules and privacy controls? See data governance.
- Culture and decisions: are decisions made with data before they are taken, or justified with data afterwards?
Worked example: a self-assessment
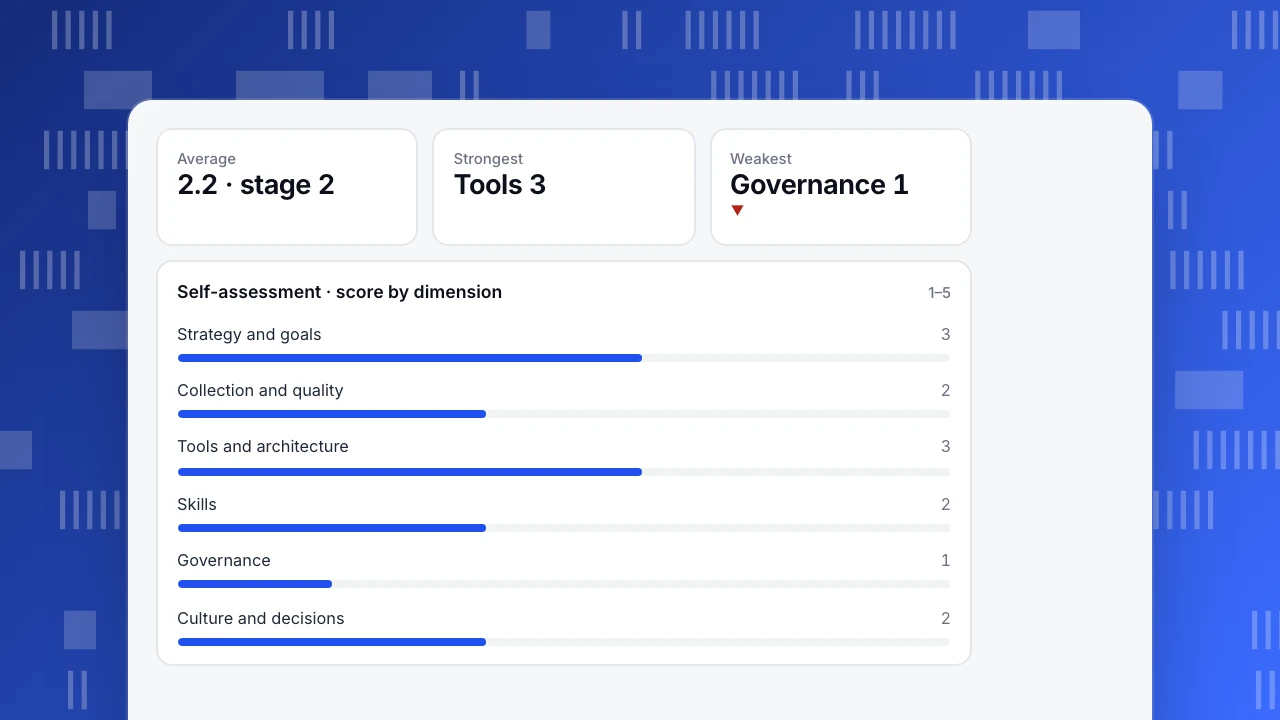
A 150-person SaaS company scored itself 1–5 on each dimension in a workshop with leaders from product, marketing, sales and finance (sample data):
| Dimension | Score | Evidence |
|---|---|---|
| Strategy and goals | 3 | Data goals exist for two teams, not company-wide |
| Collection and quality | 2 | No tracking plan; 14 duplicate sign-up events |
| Tools and architecture | 3 | Analytics tool plus warehouse; no shared metrics |
| Skills | 2 | Two analysts answer every question |
| Governance | 1 | No owners or definitions; anyone edits dashboards |
| Culture and decisions | 2 | Data used to justify decisions after the fact |
| Average | 2.2 |
Reading the result. The average says "stage 2: reporting". The more useful insight is the spread: tools score 3 while governance scores 1. The company has bought ahead of its foundations; adding a BI tool would make the problem worse, multiplying dashboards with conflicting numbers.
The plan for the next two quarters targets the two weakest dimensions:
- Governance 1 → 3: name owners for 15 core metrics, write them in a data dictionary, certify one dashboard per team. See single source of truth.
- Collection and quality 2 → 3: write a tracking plan, merge duplicate events, add data quality alerts.
- Skills 2 → 3 follows naturally: once definitions are trustworthy, train product managers to build their own funnels and retention reports. See data democratization.
Re-score in six months with the same group and the same questions.
Average
2.2 · stage 2
Strongest
Tools 3
Weakest
Governance 1
▼
Self-assessment · score by dimension
1–5Self-assessment questions
| Dimension | Stage 2 answer | Stage 4 answer |
|---|---|---|
| Strategy | KPIs are reported monthly | Each team has data-driven goals with owners and reviews |
| Collection | Main events tracked, gaps known | Tracking plan enforced; schema changes reviewed |
| Tools | Dashboards in one tool | Warehouse, metric layer, experimentation platform |
| Skills | Analysts build reports for others | Most managers query data; data scientists build models |
| Governance | Some definitions written down | Owners, access control, lineage, privacy reviews |
| Culture | Data reviewed after decisions | Decisions start from a hypothesis and a metric |
Common mistakes
- Skipping stages with tools. Machine learning on unreliable data creates confident wrong answers.
- One score for the whole company. Marketing may be at stage 4 while finance is at stage 2.
- Treating maturity as the goal. The goal is better decisions; maturity is a way to find what blocks them.
- Assessing alone. A data team scoring itself tends to over-rate tools and under-rate culture problems.
- Never re-assessing. Without a second measurement you cannot tell whether the plan worked.
Moving up a stage with TapCub
For stages 2 and 3, the product side of maturity is mostly about trustworthy collection and shared definitions. TapCub supports that with the event inbox and tracking plan, a data quality page, custom metrics shared across reports, user segments and self-serve funnels. For stage 4 work, export raw events to your warehouse or ask questions through the AI assistant.
Sources
- Davenport, T. H. (2006). Competing on analytics. Harvard Business Review, January 2006.
- Davenport, T. H. and Harris, J. G. (2017). Competing on Analytics, updated ed. Harvard Business Review Press.
- CMMI Institute (2014). Data Management Maturity (DMM) Model.
Was this article helpful?
We use your answers to fix and expand this page.
Couldn’t send. Please try again in a minute.
Thanks for the feedback. We’ll use it to improve this page.You’ve already sent feedback on this page. Thanks.

Product Experience Specialist
Writes about product experience, practical workflows, and growth, turning complex processes into clear steps for everyday decisions.