Try it on your own data
Every report in this article is in the free plan. One snippet for web and apps, up to 10 sites.
Start freeWhen marketing, product and finance each bring a different number to the same meeting, the problem is rarely the data. It is the missing agreement on definitions, owners and tolerances. This guide explains source vs version of truth, lists why numbers disagree, and reconciles four revenue figures for one month into named metrics everyone can use.
What you will learn
- SSOT means one agreed definition and owner per metric
- Data can live in many systems; definitions must be unique
- Name a system of record for each entity and reconcile to it
- Set explicit tolerances instead of chasing zero difference
- Announce and annotate every definition change
What is a single source of truth?
A single source of truth (SSOT) is the practice of keeping one authoritative, agreed version of each important piece of data, such as customers, revenue, active users or product catalog, so that every report, team and tool uses the same values and definitions. When two dashboards disagree, the SSOT is where the question "which one is right?" gets settled.
The term comes from information architecture: each data element is mastered (created and edited) in exactly one place, and everywhere else refers to it rather than keeping its own copy.
Single source of truth vs single version of truth
The two are often confused:
| Single source of truth | Single version of truth | |
|---|---|---|
| Meaning | One system of record for each entity | One agreed definition and number for each metric |
| Example | Billing system is the master for invoices | "Monthly active users" is defined once, computed once |
| Failure without it | Two CRMs with different customer addresses | Marketing reports 14,900 active users, product reports 12,400 |
| Typical solution | Master data management, system-of-record rules | Data dictionary, metric layer, certified dashboards |
In analytics, the second problem is far more common. Data can legitimately live in many systems; what must be unique is the definition and the owner of each metric.
| Single source of truth | Single version of truth | |
|---|---|---|
| Meaning | One system of record per entity | One definition per metric |
| Example | Billing masters invoices | MAU defined once |
| Solution | Master data rules | Data dictionary, metric layer |
In analytics, the version-of-truth problem is the more common one.
Why numbers disagree
| Cause | Example |
|---|---|
| Different definitions | "Active" = logged in vs any tracked event vs paying |
| Different time zones or cut-offs | UTC day vs local day; month-end close vs calendar month |
| Different filters | Bots, internal traffic, test accounts included in one report only |
| Different identity | Counting devices vs visitors vs logged-in people |
| Collection gaps | Ad blockers, consent, missing server events |
| Timing | Refunds and late events posted after a report was exported |
See why analytics tools show different numbers for a deeper reconciliation checklist.
Worked example: three revenue numbers for one month
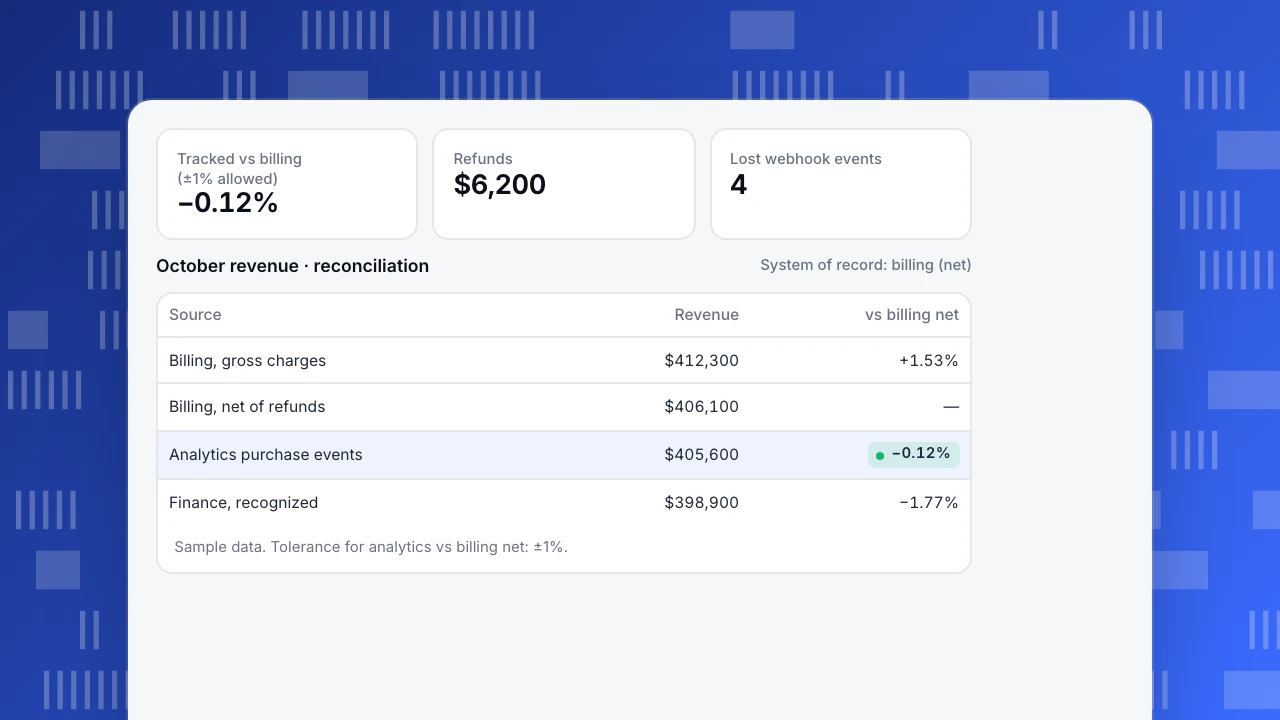
The weekly meeting has three revenue figures for October (sample data):
| Source | Revenue | Why it differs |
|---|---|---|
| Billing system, gross charges | $412,300 | Includes charges later refunded |
| Billing system, net of refunds | $406,100 | $6,200 refunded during the month |
| Analytics purchase events | $405,600 | 4 purchase events lost when the webhook timed out ($500) |
| Finance, recognized revenue | $398,900 | Annual plans recognized monthly, not when charged |
None of these is wrong; each answers a different question. The fix is to decide, in writing:
- System of record for money: billing, net of refunds. Every revenue figure in dashboards is reconciled to it.
- Allowed difference: analytics purchase events must be within ±1% of billing net revenue. Here the gap is 0.12%, inside tolerance; above it, someone investigates.
- Named metrics: "Bookings" (net charges), "Recognized revenue" (finance) and "Tracked revenue" (analytics, for attribution and funnels) each get a definition, an owner and a place they are calculated.
- Labels on every chart: which metric, which source, which time zone.
After this, the meeting stops debating the number and starts discussing the trend.
Tracked vs billing (±1% allowed)
−0.12%
Refunds
$6,200
Lost webhook events
4
October revenue · reconciliation
System of record: billing (net)| Source | Revenue | vs billing net |
|---|---|---|
| Billing, gross charges | $412,300 | +1.53% |
| Billing, net of refunds | $406,100 | — |
| Analytics purchase events | $405,600 | −0.12% |
| Finance, recognized | $398,900 | −1.77% |
Sample data. Tolerance for analytics vs billing net: ±1%.
How to build a single source of truth
- Inventory the metrics that matter. Start with 10 to 20 used in leadership reports, not every column in the warehouse. A metric tree helps pick them.
- Name a system of record for each entity: customers (CRM), money (billing), behavior (analytics), product catalog (commerce platform).
- Write definitions in a data dictionary: formula, filters, identity, time zone, owner, last reviewed.
- Move data through governed pipelines into one place where metrics are computed once, whether a warehouse with a metric layer or an analytics tool with saved metric definitions.
- Certify dashboards. Mark the ones that use the official definitions; label everything else as exploratory.
- Reconcile on a schedule with explicit tolerance thresholds, and record data lineage so anyone can trace a number back to its source.
- Assign ownership and a change process. Definitions change; when they do, annotate charts and notify users. This is the core of data governance.
Common mistakes
- Thinking SSOT means one database. Forcing everything into one tool often fails; agreeing definitions and lineage works.
- Trying to define everything at once. Start with the metrics leadership actually uses.
- No owner. A definition without an owner drifts within months.
- Silent definition changes. A filter change that drops 8% of "active users" must be announced and annotated.
- Expecting perfect agreement. Different systems measure different things; set tolerances, do not chase zero difference.
Single source of truth in TapCub
- Saved metric definitions: define a metric once as a custom metric and reuse it across analyses and dashboards, so "activated users" means the same everywhere.
- Tracking plan and data quality page: events and properties are defined in one place, with warnings when new or misspelled ones appear.
- Purchases with an order id from server-side events, so tracked revenue can be reconciled to billing line by line.
- Chart annotations to record definition changes.
- Raw data export and SQL when your warehouse is the system of record for joined metrics.
See also: What is martech? Categories, stack examples and how to manage it, Lakehouse vs warehouse.
Sources
- DAMA International (2017). DAMA-DMBOK: Data Management Body of Knowledge, 2nd ed. Technics Publications.
- Atlassian. Building a true single source of truth for your team.
- Kimball, R. and Ross, M. (2013). The Data Warehouse Toolkit, 3rd ed. Wiley (conformed dimensions).
Was this article helpful?
We use your answers to fix and expand this page.
Couldn’t send. Please try again in a minute.
Thanks for the feedback. We’ll use it to improve this page.You’ve already sent feedback on this page. Thanks.

Product Experience Specialist
Writes about product experience, practical workflows, and growth, turning complex processes into clear steps for everyday decisions.