Dashboards
16 articles tagged “Dashboards”. Tags cut across categories, so you may find analytics, chat and product notes side by side.
Tagged Dashboards
16 articles
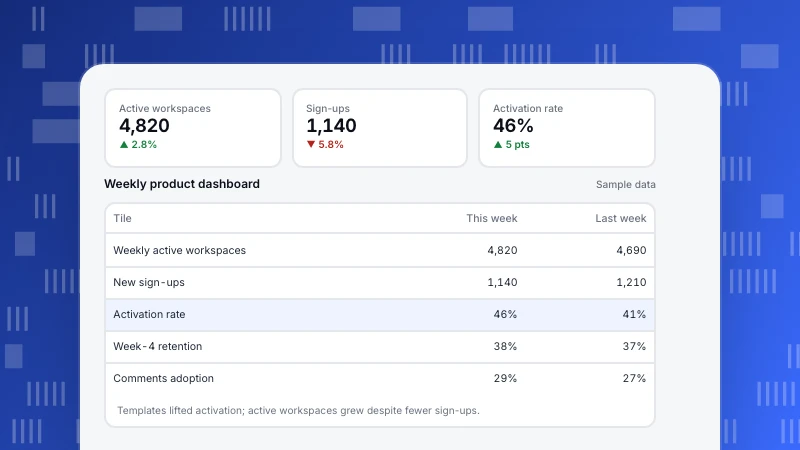
Product analytics dashboard: what to include and an example
What to put on a product analytics dashboard: north star, activation, engagement, adoption, retention, revenue and quality. Six steps to build it and a weekly example.
Read more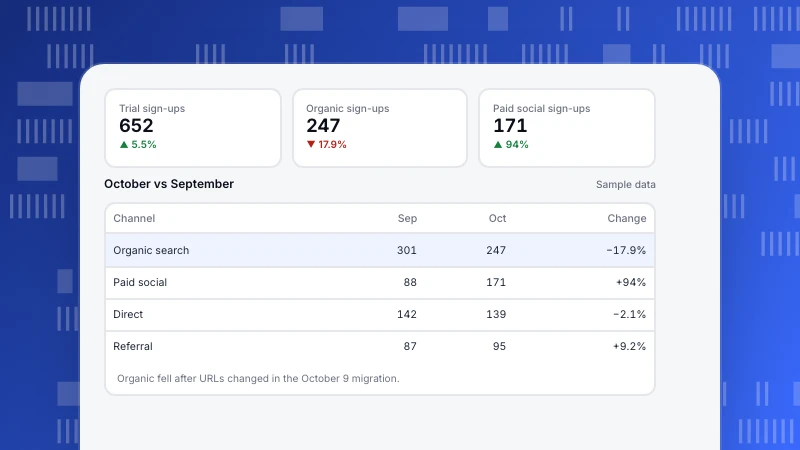
Web analytics report: what to include, types and an example
How to write a web analytics report that leads to action: report types by audience, what to include, six steps and a one-page monthly example.
Read more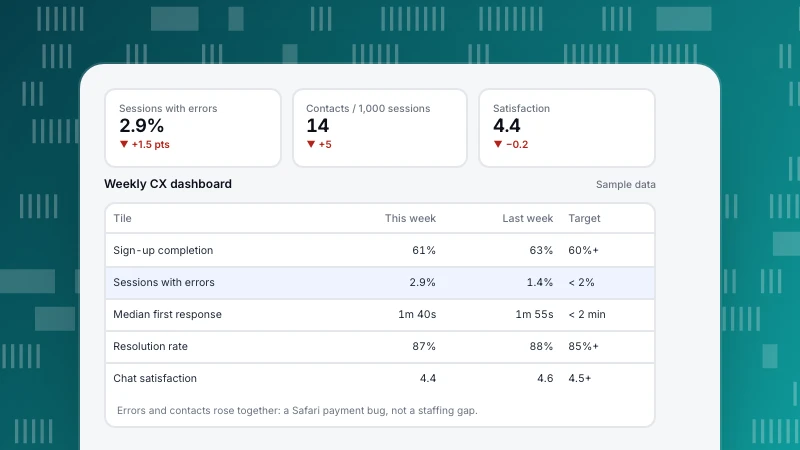
Customer experience dashboard: metrics, layout and examples
What to put on a customer experience dashboard: digital experience, support, satisfaction and outcome metrics, five steps to build one, an example layout and common mistakes.
Read more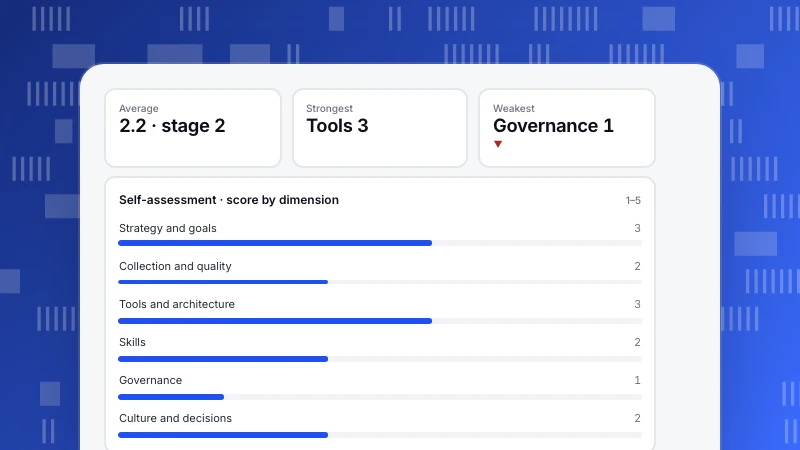
Data maturity model: five stages, a self-assessment and what to fix first
A data maturity model shows how organizations progress from ad hoc spreadsheets to data embedded in decisions. Five stages, six dimensions to score, a worked self-assessment where tools outran governance, and the questions to ask.
Read more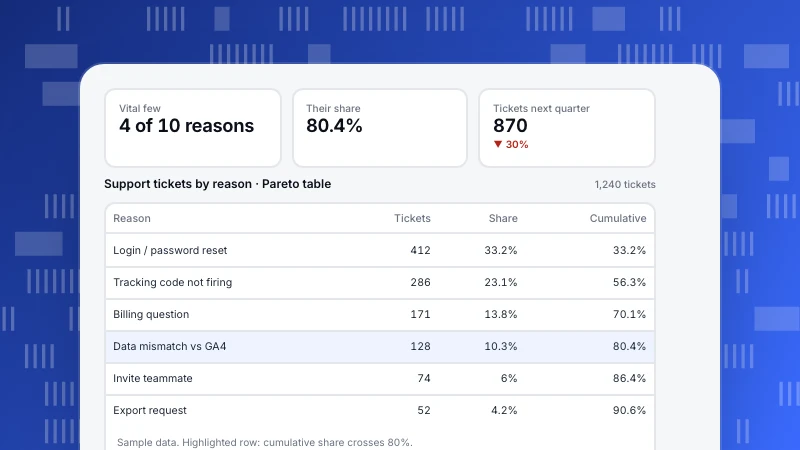
Pareto analysis: how to find the 20% that drives 80% of results
Pareto analysis finds the few causes behind most of an effect. The 8 steps, a support-ticket example where 4 of 10 reasons caused 80% of tickets, a traffic concentration example, analytics use cases and the mistakes that make the 80/20 rule misleading.
Read more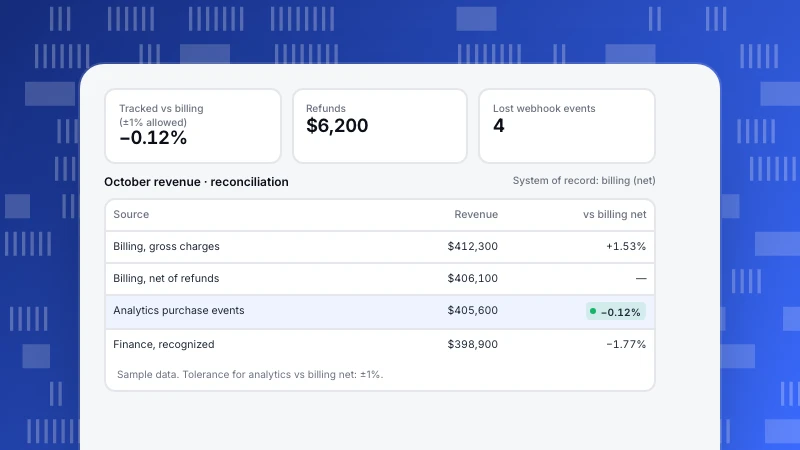
Single source of truth for analytics: definitions, owners and reconciliation
A single source of truth means one agreed value and definition for each important metric. Source vs version of truth, why numbers disagree, a worked example reconciling four October revenue figures, and the steps to make it stick.
Read more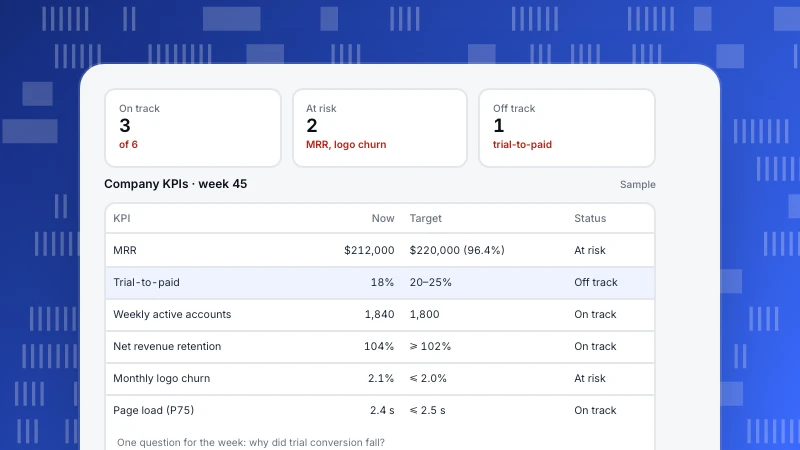
KPI Dashboard: How to Design One People Actually Use
A KPI dashboard shows a handful of key numbers, each with a target and a status, so anyone can see in a minute what is on track. Eight design rules, a sample company dashboard, and how to build one in six steps.
Read more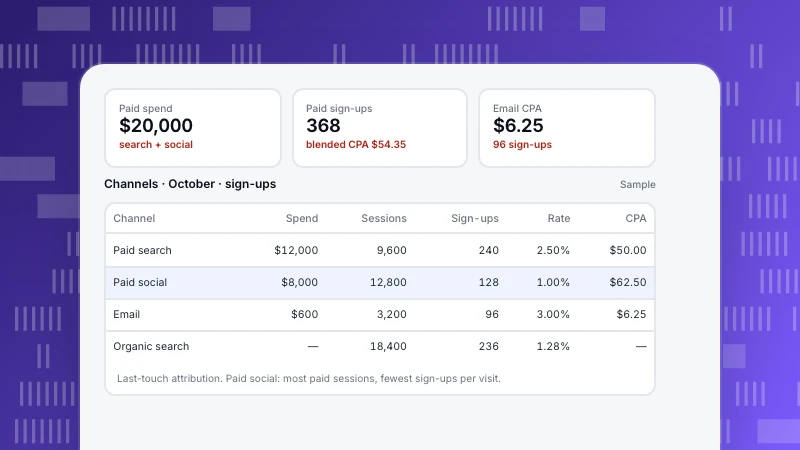
Marketing Dashboard: What to Include, With a Sample Layout
A marketing dashboard shows which channels bring customers and at what cost. The five sections to include, a sample channel table with spend, conversions and CPA, blended vs channel numbers, and the mistakes that make dashboards misleading.
Read more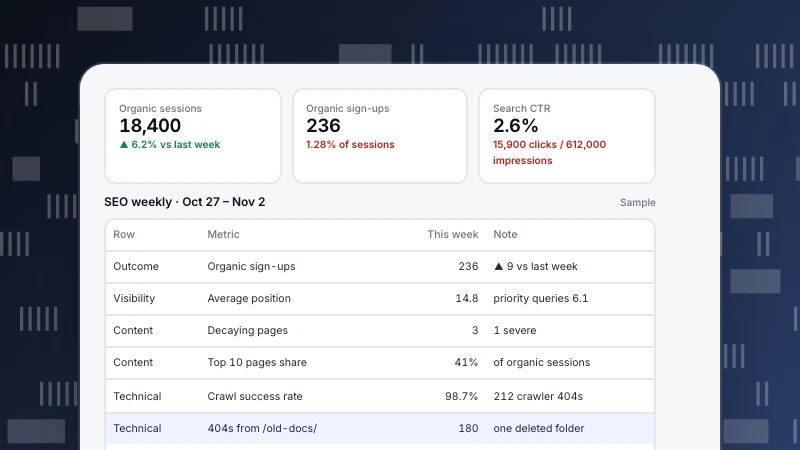
SEO Dashboard: What to Include and How to Read It
An SEO dashboard should answer three questions: is organic search bringing business, are we more visible, and is anything broken. A four-row layout, a sample weekly dashboard with numbers, and what to leave out.
Read more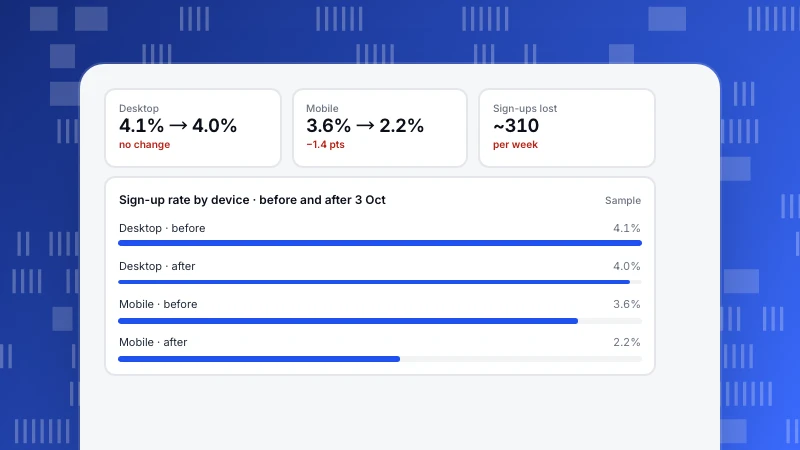
Data Storytelling: A Five-Part Structure, With a Before and After
Data storytelling turns an analysis into a decision someone can act on. A five-part structure for reports and presentations, the same analysis told badly and well, chart-choice rules and how to keep the story honest.
Read more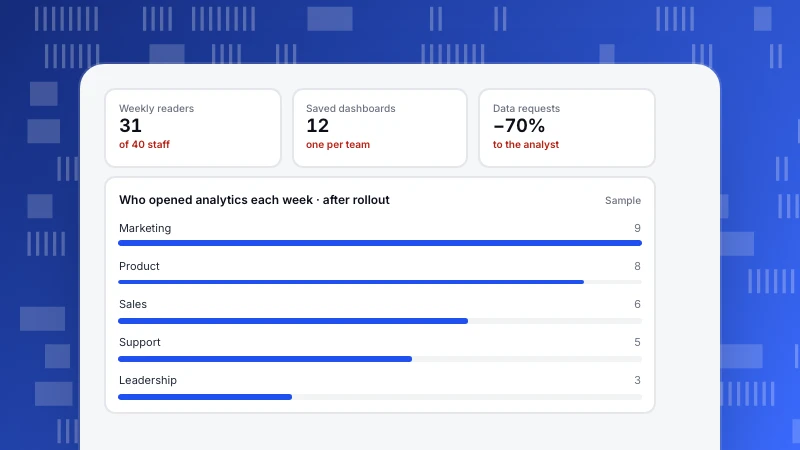
Data Democratization: Give Everyone Data Without Losing Trust
Data democratization means anyone who needs data can get it and read it the same way. What it is, five practical steps from shared definitions to read-only links, a sample role setup, and the risks to manage.
Read more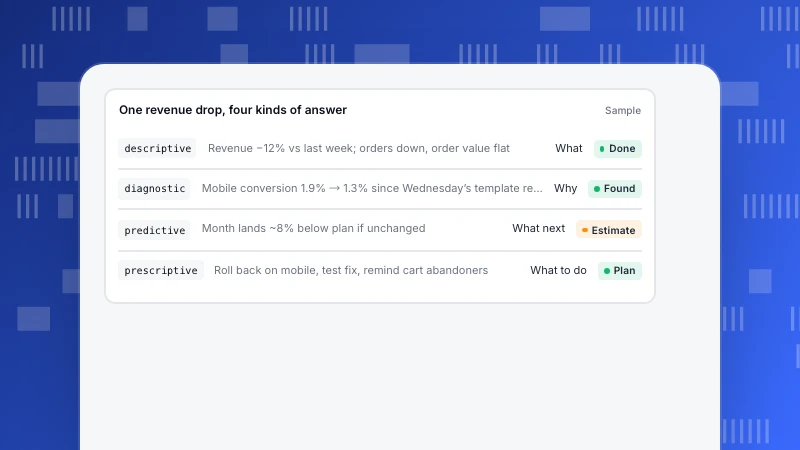
The 4 Types of Data Analytics, Followed Through One Real Question
Descriptive analytics says what happened, diagnostic why, predictive what will happen, and prescriptive what to do. One store’s revenue drop followed through all four, with the method and data each step needs.
Read more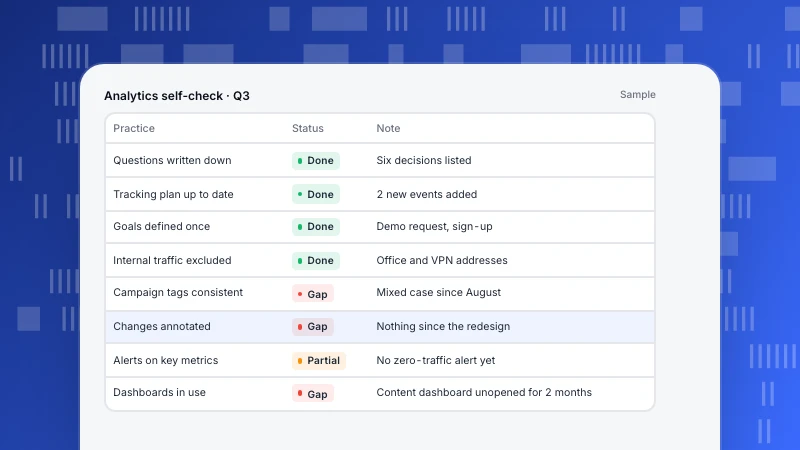
Web Analytics Best Practices: 12 Habits That Keep Data Trustworthy
Twelve web analytics best practices in four groups, plan, collect, read and act, each with a quick way to check you are following it. The habits that keep numbers trustworthy and make sure someone actually uses them.
Read more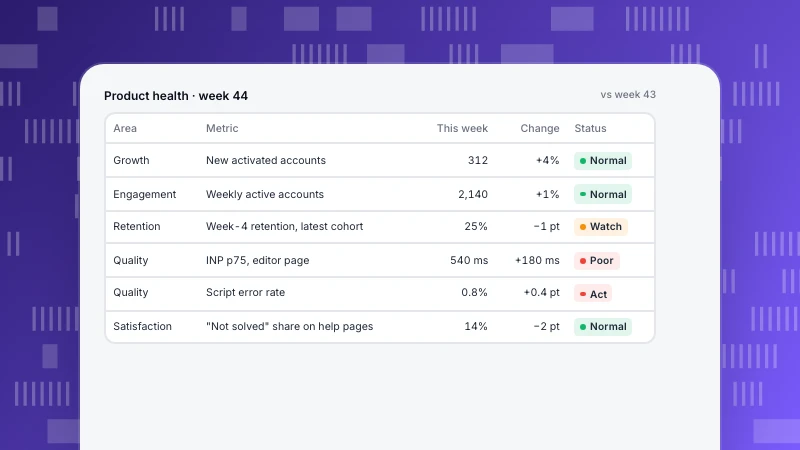
Product Health Metrics: A Weekly Scorecard That Includes Quality
Product health metrics in five areas (growth, engagement, retention, quality, satisfaction) on one weekly scorecard, with thresholds that turn a number amber or red and a routine for reviewing it.
Read more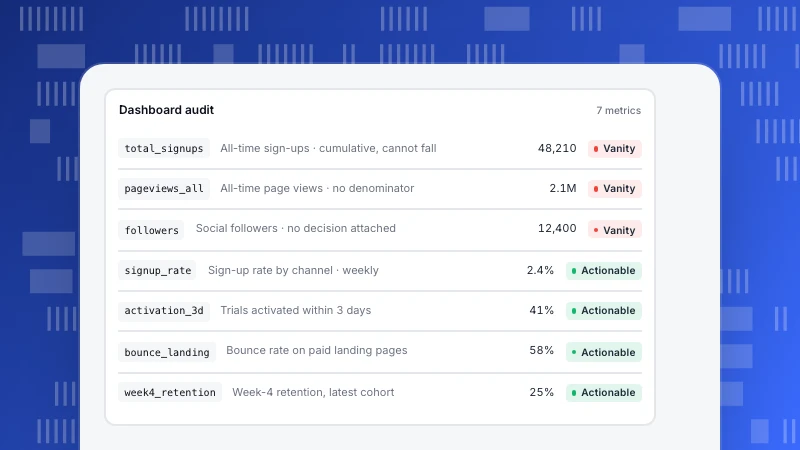
Actionable Metrics: A Test, Rewrites and Decision Rules
How to tell an actionable metric from a vanity metric with five questions, rewrites of common vanity metrics, and the decision-rule format that turns a dashboard number into an action.
Read more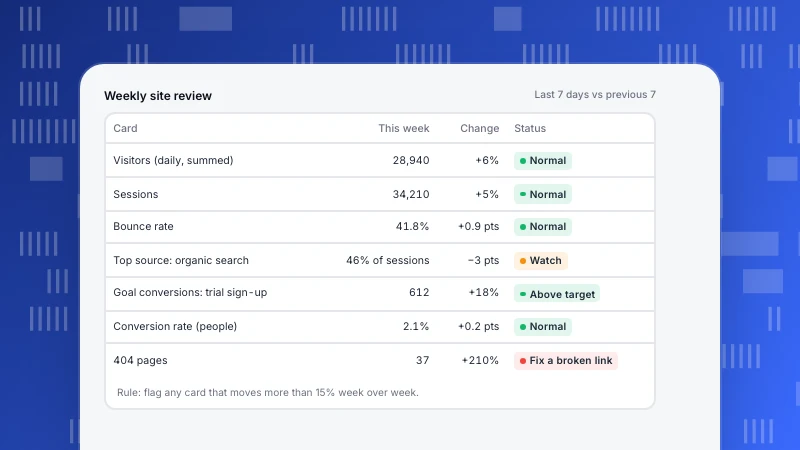
Analytics Dashboard: What to Put on It, by Role (Template)
An analytics dashboard should answer one person's recurring question on one screen. Layouts by role, a weekly website template, six build steps and the mistakes that make dashboards lie.
Read more