Try it on your own data
Every report in this article is in the free plan. One snippet for web and apps, up to 10 sites.
Start freeSEO dashboards often show dozens of tiles and answer nothing. This guide gives a four-row layout that goes from business outcome to technical cause, walks through a sample weekly dashboard with numbers, and lists what to leave out.
What you will learn
- Order the dashboard from outcome (sign-ups from organic) to visibility, content and technical health
- A weekly view should end in a short list of actions, not a status report
- Leave out vendor scores and long ranking lists; track a short list of priority queries
What an SEO dashboard is for
An SEO dashboard puts the numbers that describe your organic search performance in one place, so you can see each week whether search is working and where to look next. A good one answers three questions in this order:
- Is organic search bringing business? Sign-ups, leads, orders from organic visits.
- Are we more visible? Clicks, impressions, click-through rate and average position.
- Is anything broken? Pages losing traffic, crawl errors, slow pages.
A dashboard that only shows rankings answers the second question and skips the other two.
A four-row layout
Order the dashboard from outcome to cause. The table below lists what goes in each row, where the data comes from and how often to look.
| Row | What to show | Where it comes from | Review |
|---|---|---|---|
| 1. Outcome | Organic sessions, sign-ups, leads or revenue from organic, conversion rate | Analytics: sources filtered to organic, goals | Weekly |
| 2. Visibility | Clicks, impressions, CTR, average position, priority queries | Google Search Console, Bing Webmaster | Weekly / monthly |
| 3. Content | Top landing pages, decaying pages, new pages indexed, AI referrals | Analytics landing pages, content decay | Monthly |
| 4. Technical | Crawl errors, 404s, 5xx, Core Web Vitals | Server logs, crawl reports, performance | Weekly |
Put the business outcome on top. Rankings explain results; they are not the result.
A sample weekly SEO dashboard
Here is how one week might look for a B2B SaaS site (sample numbers):
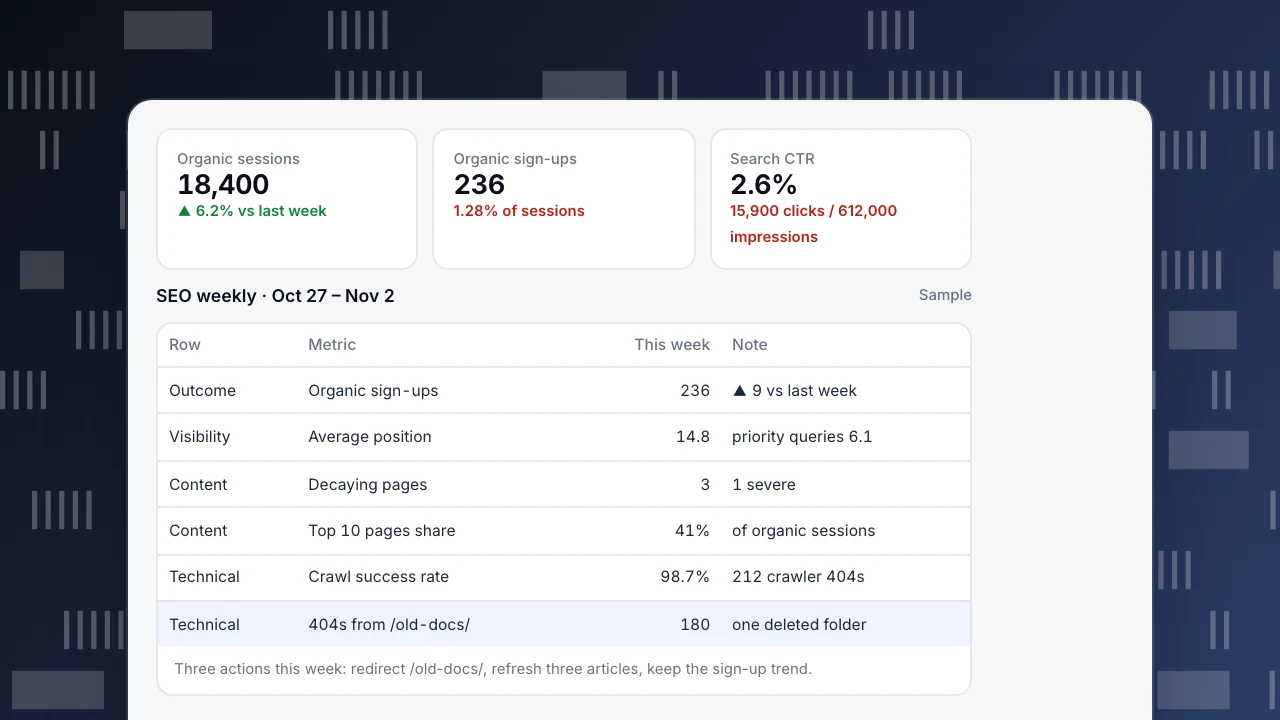
- Outcome: 18,400 organic sessions (+6.2% on the previous week), 236 organic sign-ups, a 1.28% sign-up rate.
- Visibility: 15,900 clicks on 612,000 impressions, a 2.6% CTR, average position 14.8.
- Content: three pages marked decaying, one severely; the top 10 landing pages bring 41% of organic sessions.
- Technical: 98.7% crawl success rate; 212 crawler 404s, 180 of them on one deleted folder.
The story for the week: traffic and sign-ups are up, one old folder is producing most crawler errors, and three articles need a refresh. That is three actions, which is what a dashboard should produce.
Organic sessions
18,400
▲ 6.2% vs last week
Organic sign-ups
236
1.28% of sessions
Search CTR
2.6%
15,900 clicks / 612,000 impressions
SEO weekly · Oct 27 – Nov 2
Sample| Row | Metric | This week | Note |
|---|---|---|---|
| Outcome | Organic sign-ups | 236 | ▲ 9 vs last week |
| Visibility | Average position | 14.8 | priority queries 6.1 |
| Content | Decaying pages | 3 | 1 severe |
| Content | Top 10 pages share | 41% | of organic sessions |
| Technical | Crawl success rate | 98.7% | 212 crawler 404s |
| Technical | 404s from /old-docs/ | 180 | one deleted folder |
Three actions this week: redirect /old-docs/, refresh three articles, keep the sign-up trend.
What to leave out
- Dozens of keyword rankings. Track a short list of priority queries; the rest belongs in a separate report.
- Domain authority-style scores. They are vendor estimates, not search engine data.
- Raw backlink counts. Watch new referring domains monthly, not total links weekly.
- Metrics nobody acts on. If a tile has not changed a decision in a quarter, remove it.
How often to review
- Weekly (15 minutes): rows 1 and 4. Catch drops and breakages early.
- Monthly: all four rows, compared with the previous month and the same month last year where you have it. Search data moves slowly, so most decisions belong here.
- Quarterly: review the list of priority queries and the dashboard itself.
Annotate releases, migrations and algorithm updates on the charts so a change in the line has a reason next to it.
Building it in TapCub
- Outcome: in Web analytics › Sources, filter to organic search and read goal conversions; save an analysis of sign-ups by channel and put it on a dashboard in All-platform analytics › Overview › My dashboards.
- Visibility: connect Google Search Console or Bing Webmaster in Monitoring › Search performance for clicks, impressions, CTR and average position by page and query. Pages in the top 10 with a CTR below the median are flagged first.
- Content: Monitoring › Content decay compares each page's peak four weeks of organic visitors with the latest four and marks pages decaying or growing. The AI sources tab in Sources shows visits from AI assistants.
- Technical: Monitoring › Crawl health shows fetches, success rate, 404s and 5xx by search engine (status codes need server logs).
Dashboards hold saved analyses, text and dividers; search performance and crawl health stay on their own pages, so link to them from a text card. See also organic traffic and keyword cannibalization.
See also
Was this article helpful?
We use your answers to fix and expand this page.
Couldn’t send. Please try again in a minute.
Thanks for the feedback. We’ll use it to improve this page.You’ve already sent feedback on this page. Thanks.

Customer Experience Consultant
Writes about live chat, visitor conversations, and self-service, sharing practical ways to make customer communication clearer and more effective.