Try it on your own data
Every report in this article is in the free plan. One snippet for web and apps, up to 10 sites.
Start freeSEO reports often list twenty metrics with equal weight. This guide narrows them to ten KPIs in three tiers, business, visibility and technical health, with formulas and data sources, a sample quarterly scorecard and advice on setting targets.
What you will learn
- Judge SEO first by business KPIs: organic conversions and conversion rate
- Report branded and non-branded traffic separately so brand growth does not look like SEO work
- Use leading targets (impressions, indexed pages) for new content and outcome targets after it ranks
KPIs vs metrics
SEO tools report hundreds of metrics. A KPI is one of the few you have agreed to judge SEO by, with a target and an owner. Everything else is a diagnostic: useful when a KPI moves, not worth reporting every week.
A practical set has three tiers: business (does SEO bring customers?), visibility (are we found for the right queries?) and health (can search engines crawl and index us?).
Ten SEO KPIs
The table below lists ten KPIs, how to calculate them and where the data comes from.
| Tier | KPI | How to calculate | Data source |
|---|---|---|---|
| Business | Organic conversions | Goal completions from organic search sessions | Analytics: sources + goals |
| Business | Organic conversion rate | Organic conversions ÷ organic sessions | Analytics |
| Business | Organic revenue or pipeline | Revenue or qualified leads from organic visitors | Analytics + CRM |
| Visibility | Non-branded clicks | Clicks from queries without your brand name | Search Console |
| Visibility | Impressions | Times your pages appeared in results | Search Console |
| Visibility | CTR | Clicks ÷ impressions | Search Console |
| Visibility | Priority queries in top 10 | Count of target queries at average position ≤ 10 | Search Console |
| Health | Indexed pages ratio | Indexed ÷ submitted pages in sitemap | Search Console |
| Health | Crawl errors | Share of crawler fetches with 4xx or 5xx | Server logs |
| Health | Core Web Vitals pass rate | Pages rated good on LCP, INP, CLS | Field data |
Pick three to five as KPIs with targets; keep the rest as diagnostics.
Why split branded and non-branded
Branded searches ("tapcub pricing") mostly come from people who already know you; they grow with marketing and word of mouth, not with SEO work. Non-branded queries ("seo dashboard template") are where content and technical SEO make a difference. Report them separately, or a brand campaign will look like an SEO win.
A sample quarterly scorecard
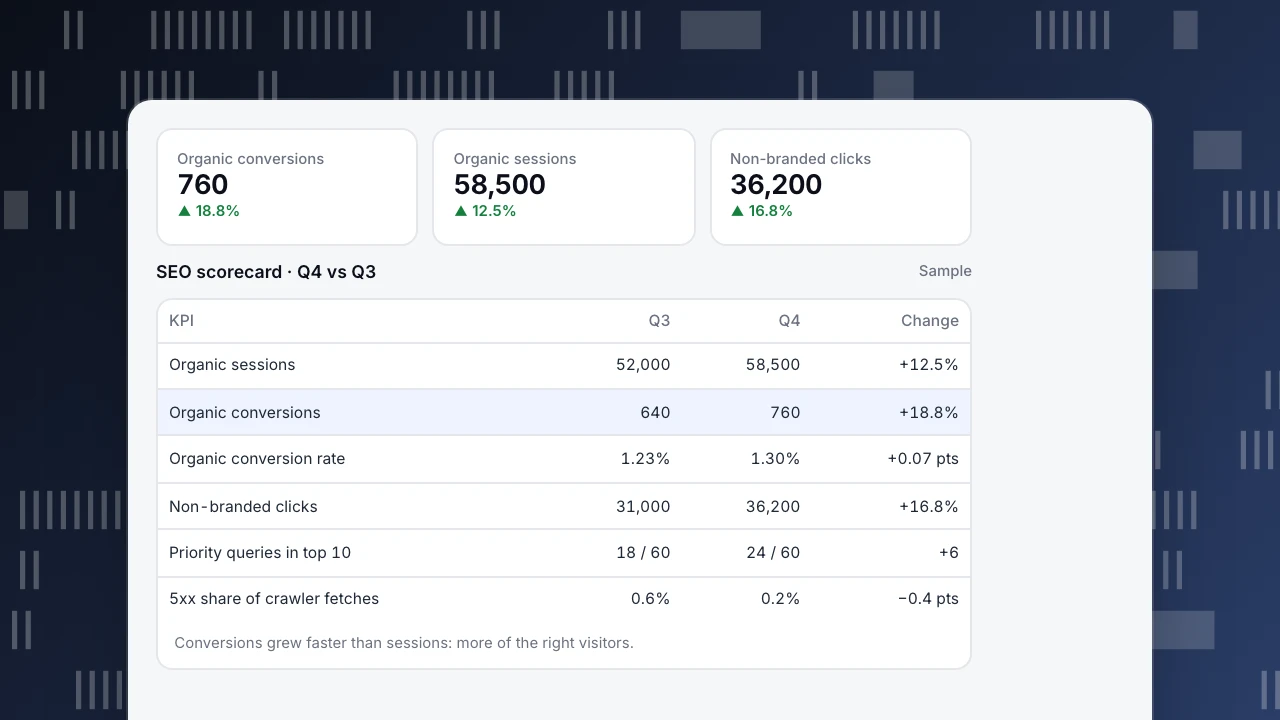
A B2B SaaS site compares Q3 with Q4 (sample numbers):
- Organic sessions rose from 52,000 to 58,500 (+12.5%).
- Organic conversions rose from 640 to 760 (+18.8%), so the conversion rate improved from 1.23% to 1.30%.
- Non-branded clicks rose from 31,000 to 36,200 (+16.8%), faster than total traffic: the growth came from SEO work, not brand.
- Priority queries in the top 10 went from 18 of 60 to 24 of 60.
- Server errors seen by crawlers fell from 0.6% to 0.2% of fetches after a hosting fix.
Conversions growing faster than sessions is the line to lead with: SEO brought more of the right visitors.
Organic conversions
760
▲ 18.8%
Organic sessions
58,500
▲ 12.5%
Non-branded clicks
36,200
▲ 16.8%
SEO scorecard · Q4 vs Q3
Sample| KPI | Q3 | Q4 | Change |
|---|---|---|---|
| Organic sessions | 52,000 | 58,500 | +12.5% |
| Organic conversions | 640 | 760 | +18.8% |
| Organic conversion rate | 1.23% | 1.30% | +0.07 pts |
| Non-branded clicks | 31,000 | 36,200 | +16.8% |
| Priority queries in top 10 | 18 / 60 | 24 / 60 | +6 |
| 5xx share of crawler fetches | 0.6% | 0.2% | −0.4 pts |
Conversions grew faster than sessions: more of the right visitors.
Setting targets
- Start from the baseline and the plan. If you will publish 30 pages a quarter that each reach 300 monthly visits after six months, the traffic target follows from that.
- Allow for lag. New pages often take three to six months to rank. Set leading targets (indexed pages, impressions) for the first quarter and outcome targets after.
- Account for seasonality. Compare with the same period last year where you have it.
- Keep business KPIs on top. A higher average position that brings no conversions is not progress.
Where each KPI comes from in TapCub
- Organic sessions, conversions and conversion rate: Web analytics › Sources filtered to organic search, with goals.
- Clicks, impressions, CTR, average position: Monitoring › Search performance after connecting Google Search Console or Bing Webmaster, by page and query.
- Pages losing organic traffic: Monitoring › Content decay.
- Crawl success rate, 404s, 5xx: Monitoring › Crawl health, which needs server logs for status codes.
Put the business tier on a dashboard and review it weekly; see SEO dashboard for a layout, and how to calculate CTR for click-through rate.
See also
Was this article helpful?
We use your answers to fix and expand this page.
Couldn’t send. Please try again in a minute.
Thanks for the feedback. We’ll use it to improve this page.You’ve already sent feedback on this page. Thanks.

Customer Experience Consultant
Writes about live chat, visitor conversations, and self-service, sharing practical ways to make customer communication clearer and more effective.