Try it on your own data
Every report in this article is in the free plan. One snippet for web and apps, up to 10 sites.
Start freeA social media dashboard that shows only likes and followers cannot tell you whether social media helps the business. This guide shows what to include, from reach to sign-ups, a four-row layout with the source of every number, and a worked month across four networks.
What you will learn
- Combine platform metrics (reach, engagement) with site outcomes (sessions, sign-ups) on one page
- The network with the most impressions is often not the one that brings customers
- Sessions are usually 70–90% of platform clicks; tag every link with UTM to keep the data clean
What the dashboard is for
Most social media dashboards stop at likes, followers and reach. Those show whether people see and react to your posts, but not whether social media helps the business. A useful dashboard answers three questions:
- Are we reaching the right people? (reach, impressions, followers)
- Do they care? (engagement, clicks)
- Does it lead anywhere? (site visits, sign-ups, purchases)
The first two come from each platform's own analytics. The third comes from your website or product analytics.
A four-row layout
The table below lists what to put in each row and where the numbers come from.
| Row | Metrics | Source |
|---|---|---|
| 1. Reach | Impressions, reach, follower growth | Each platform’s analytics |
| 2. Engagement | Engagement rate, link clicks, shares, saves | Each platform’s analytics |
| 3. Site visits | Sessions, engaged sessions, landing pages by network and campaign | Web analytics with UTM tags |
| 4. Outcomes | Sign-ups, purchases, revenue, rate per session by network | Goals or events in your analytics |
| Notes | What was posted, campaigns, anything unusual | Text on the dashboard |
Keep paid and organic social in separate lines.
A worked month across four networks
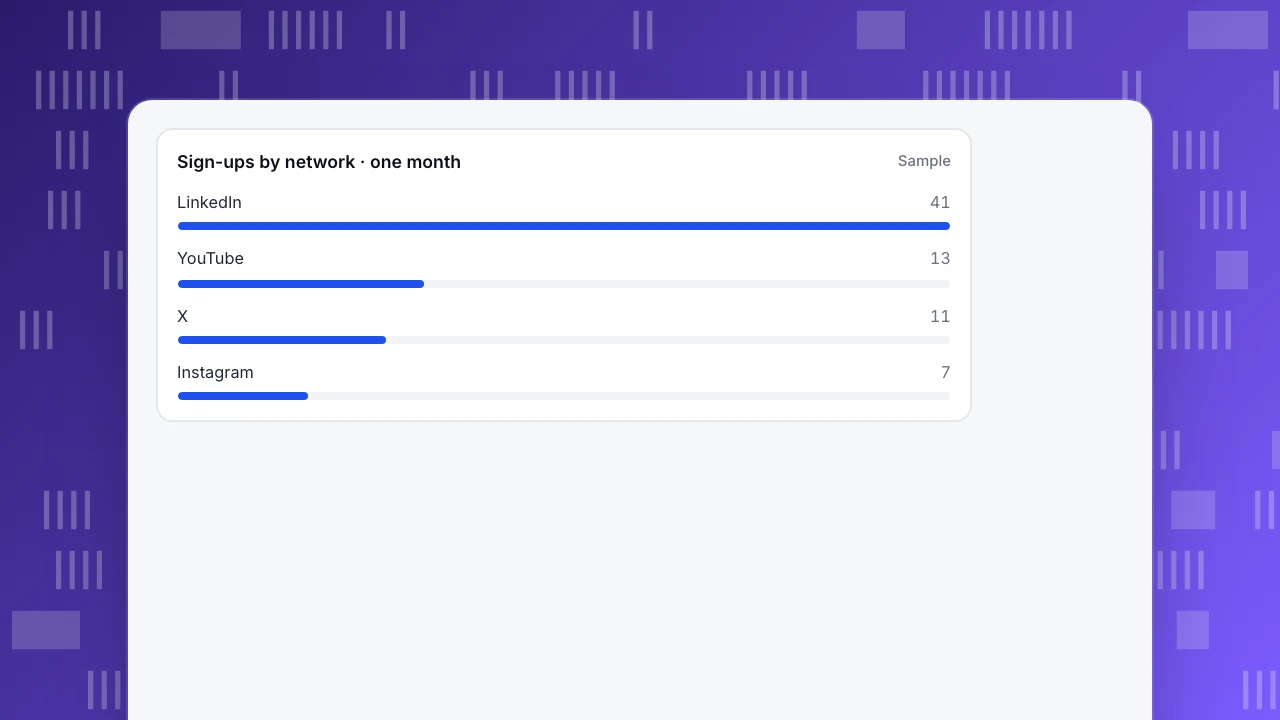
One month for a B2B software company (sample numbers):
| Network | Impressions | Link clicks | Sessions | Sign-ups | Sign-up rate |
|---|---|---|---|---|---|
| 120,000 | 2,400 | 2,050 | 41 | 2.0% | |
| X | 90,000 | 1,350 | 1,100 | 11 | 1.0% |
| 150,000 | 900 | 700 | 7 | 1.0% | |
| YouTube | 40,000 | 600 | 520 | 13 | 2.5% |
| Total | 400,000 | 5,250 | 4,370 | 72 | 1.6% |
Reading it:
- Instagram has the most impressions but the fewest sign-ups. Its job may be awareness, not acquisition; judge it on that, or change the content.
- LinkedIn brings 57% of sign-ups (41 of 72).
- YouTube is small, but its visitors convert best. It may deserve more effort.
- Across networks, sessions are 83% of platform link clicks (4,370 of 5,250). That gap is normal.
Sign-ups by network · one month
SampleWhy clicks and sessions never match
- People click and leave before the page loads.
- Ad and tracking blockers stop the analytics script.
- Platforms count repeated clicks by the same person; analytics groups them into one session.
- Some clicks open in an in-app browser that strips the referrer, so the visit shows as direct.
Expect sessions to be 70–90% of clicks. Watch the ratio over time; a sudden drop usually means broken links or lost UTM tags.
Make site data reliable
- Tag every link you control with UTM parameters:
utm_source=linkedin,utm_medium=social,utm_campaign=q4-webinar. - Use one naming convention, in lower case, written down.
- Accept that some social traffic will be invisible: links shared in private messages arrive as direct. See dark social.
Mistakes to avoid
- Reporting follower growth as success without any site outcome.
- Comparing networks only by engagement rate, which each platform defines differently.
- Mixing paid and organic social in one line.
- Changing UTM names mid-month, which splits one campaign into two rows.
The parts TapCub fills
TapCub does not import follower or engagement data from social platforms; take those from each platform's analytics. TapCub covers rows three and four:
- Web analytics › Sources shows visitors, sessions and goals by channel (including social), source and UTM campaign.
- Web analytics › Goals counts sign-ups or purchases per source, so the sign-up rate per network is one click away.
- All-platform analytics › Overview › My dashboards holds saved analyses as cards next to text cards, where you can paste the platform numbers each month, and can be shared read-only.
For the broader picture, see marketing dashboard and marketing campaign analysis.
Was this article helpful?
We use your answers to fix and expand this page.
Couldn’t send. Please try again in a minute.
Thanks for the feedback. We’ll use it to improve this page.You’ve already sent feedback on this page. Thanks.

Product Experience Specialist
Explores usability, user journeys, and feature adoption through practical examples of onboarding and everyday product use.