Try it on your own data
Every report in this article is in the free plan. One snippet for web and apps, up to 10 sites.
Start freePages that used to bring steady traffic often lose it slowly, and the site total hides it. This guide defines content decay with numbers, shows how to rule out seasonality and site-wide drops, diagnoses decay by what changed in search, and works through three pages with different fixes.
What you will learn
- Measure decay as the latest four weeks against the best four weeks over 13 weeks
- Rule out seasonality, site-wide drops and channel shifts before calling it decay
- Match the fix to what changed: impressions, position or click-through rate
What content decay is
Content decay is the slow, steady loss of traffic on a page that used to perform well. It is different from a sudden drop: decay happens over weeks or months, page by page, often unnoticed because the site total is held up by newer pages.
A useful numeric definition: over the last 13 weeks, compare the average of the latest four weeks with the average of the best four weeks.
- Under 40% of peak: severe decay.
- Under 70% of peak, with a downward trend: decaying.
- Otherwise stable, or growing if the latest weeks trend up strongly.
Rule out the look-alikes first
- Seasonality: a "Black Friday checklist" peaks every November. Compare with the same weeks last year before calling it decay.
- Site-wide drop: if most pages fell at the same time, it is a tracking, technical or algorithm issue, not decay. See sudden drop in website traffic.
- Channel shift: if search visits fell but total visits did not, the page is fine; traffic moved elsewhere.
Diagnose by what changed
For decaying pages, look at the page's search data for the same weeks. The table below matches what changed with the likely cause and fix.
| What changed in search data | Likely cause | Fix |
|---|---|---|
| Impressions down, position steady | Less demand for the topic, or seasonality | Check last year; consider broadening the page |
| Position down | Competitors improved, or the page is outdated | Update facts and depth; add internal links |
| Position steady, CTR down | New search features (AI answers, video, ads) above you | Rewrite title and snippet; add formats that appear |
| Two of your pages swapping | Keyword cannibalization | Merge or differentiate the pages |
| Page gone from results | Indexing or technical problem | Check crawl errors, noindex, canonical |
Open the page’s search data for the same weeks as the decline.
A worked example: three pages
Organic search visitors per week, 13 weeks (sample numbers):
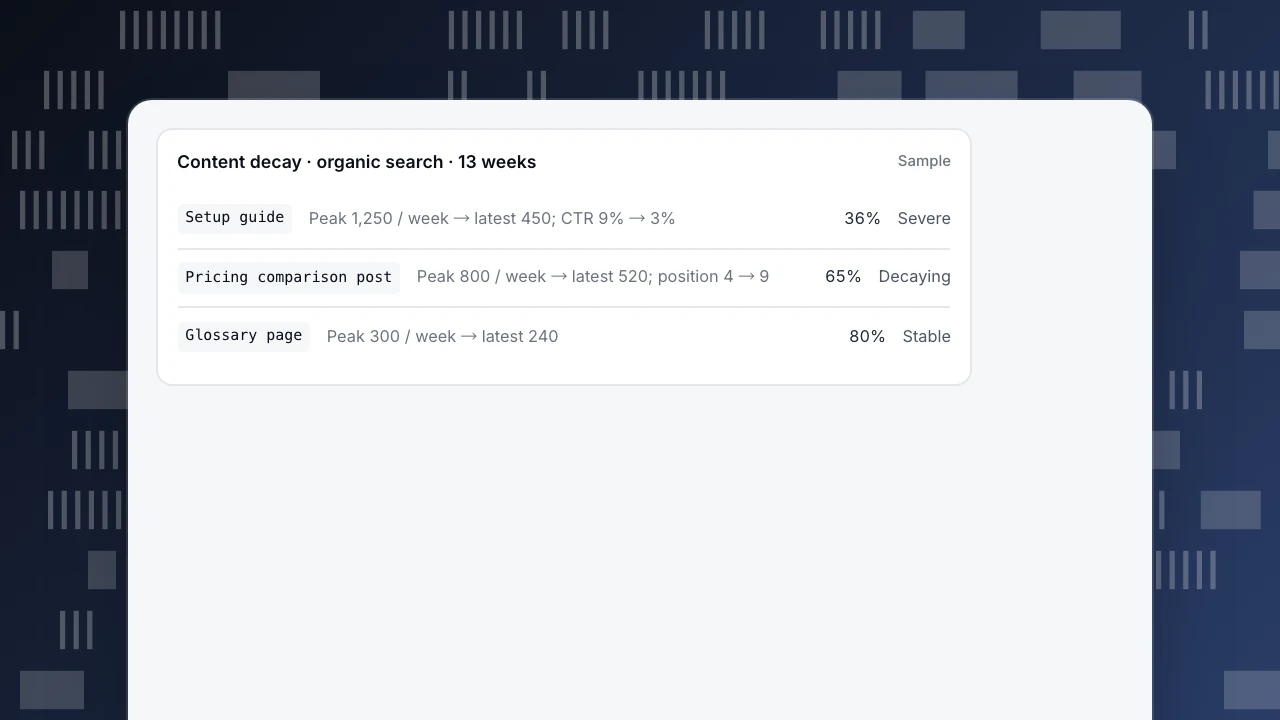
- Setup guide: best four weeks averaged 1,250 visitors a week; latest four average 450, 36% of peak, severe. Search data: position steady at 3, impressions steady, CTR fell from 9% to 3%. The results page now shows an AI answer and a video carousel above it. Fix: rewrite the title and description around the specific question, add a short step list and a video, and accept part of the loss.
- Pricing comparison post: 800 → 520 a week, 65%, decaying. Position slid from 4 to 9; the post still lists last year's prices. Fix: update prices and screenshots, add the date, and add links from two newer posts.
- Glossary page: 300 → 240, 80%, stable. Normal variation; leave it.
Four weeks after the updates, the pricing post is back to position 5 and 690 visitors a week; the setup guide recovers to 640 a week.
Content decay · organic search · 13 weeks
SampleSetup guidePeak 1,250 / week → latest 450; CTR 9% → 3%36%SeverePricing comparison postPeak 800 / week → latest 520; position 4 → 965%DecayingGlossary pagePeak 300 / week → latest 24080%Stable
Refresh, merge or leave
- Refresh when the topic still matters and the page has lost freshness or depth: update facts, examples, screenshots and the date; answer the question earlier.
- Merge when two of your pages compete for the same query; see keyword cannibalization.
- Leave stable pages and seasonal pages outside their season.
- Retire pages whose topic no longer matters; redirect if there is a close replacement. This is where a content audit helps.
Content decay in TapCub
Monitoring › Content decay looks at 13 weeks of visitors per page, one number a week, and compares the mean of the peak four weeks with the latest four. Statuses are growing, stable, decaying, severely decaying and not enough data (peak week under your threshold). The default channel is organic search; you can switch to all channels or AI sources. Results refresh hourly. Open a row to compare sources in the first four weeks of the decline with the latest four, to see whether only search dropped.
For position, impressions and CTR, connect Google Search Console or Bing in Monitoring › Search performance. Related: content performance metrics and how to improve organic search.
See also
Was this article helpful?
We use your answers to fix and expand this page.
Couldn’t send. Please try again in a minute.
Thanks for the feedback. We’ll use it to improve this page.You’ve already sent feedback on this page. Thanks.

Customer Experience Consultant
Writes about live chat, visitor conversations, and self-service, sharing practical ways to make customer communication clearer and more effective.