Try it on your own data
Every report in this article is in the free plan. One snippet for web and apps, up to 10 sites.
Start freePage views tell you an article was opened, not whether it worked. This guide groups content performance metrics into four stages for each article (found, read, acted, lasted), shows a scorecard that turns them into keep, update, merge or remove decisions, and a fixed-window check for decay.
Four stages of content performance
Content performance metrics tell you whether an article earns its place. Lists of 16 metrics are easier to use when grouped into the four things an article has to do:
- Get found: impressions and clicks in search, visitors by channel.
- Get read: time on page, scroll depth, whether readers continue to another page.
- Lead to action: sign-ups, trials, demo requests or purchases from sessions that started on the article.
- Last: whether traffic holds over months or decays.
An article can fail at any stage, and each failure has a different fix. That is why one number (page views) is not enough. The table lists the metrics per stage and where each comes from.
| Stage | Metric | Source |
|---|---|---|
| Found | Search impressions, clicks, CTR, position | Search console |
| Found | Visitors by channel | Analytics |
| Read | Average time on page, scroll depth | Analytics |
| Read | Continue rate, downstream pageviews | Analytics |
| Acted | Conversions from sessions that entered on the article | Analytics goals |
| Lasted | Latest 4 weeks vs peak 4 weeks | Analytics |
Compare articles of the same type over the same window.
Score each article
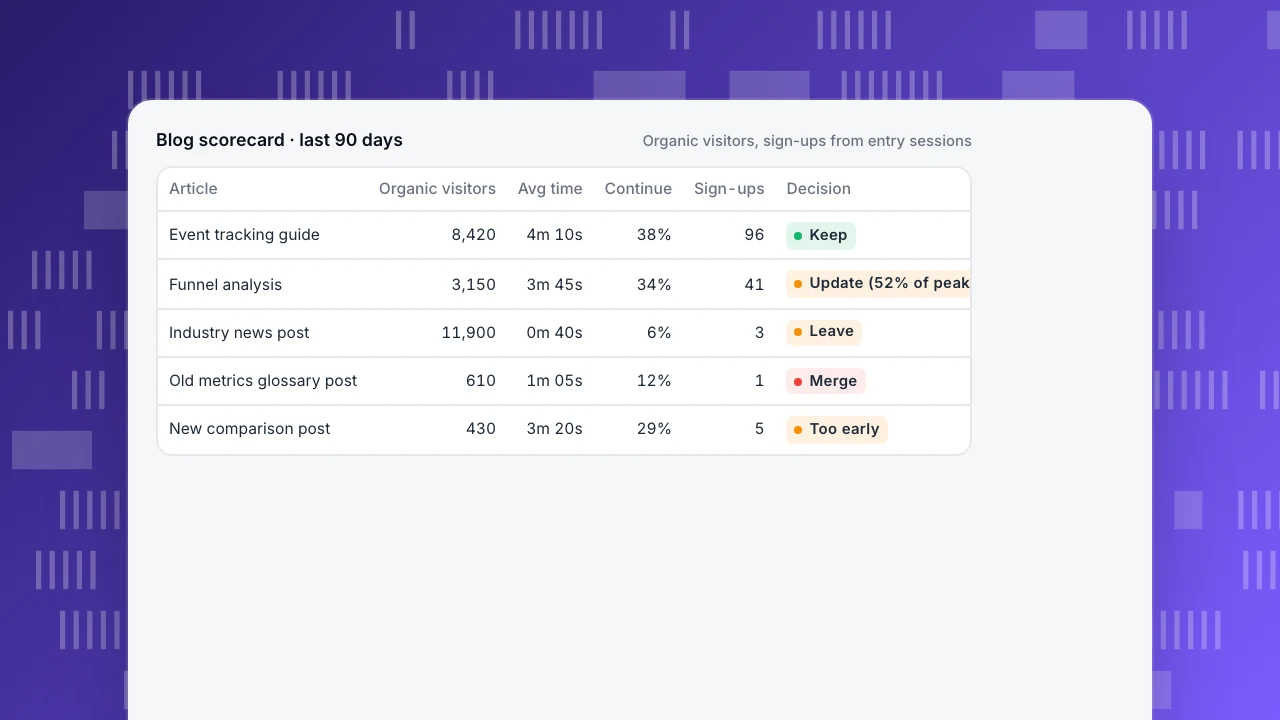
Put the stages side by side per article. The example scores five posts over 90 days:
- Event tracking guide: found, read and converting. Keep and link to it from newer posts.
- Funnel analysis: good reading and conversion, but organic visitors have dropped to half the peak. Update it.
- Industry news post: high traffic, but short reads and no sign-ups. It brings visitors who are not your audience. Leave it alone; do not use it as a model.
- Old glossary-style post: low traffic and overlaps a newer page. Merge it into that page with a redirect.
- New comparison post: too early to judge.
Use the same window for all articles, and compare articles of the same type: a reference page and a news post do different jobs.
Blog scorecard · last 90 days
Organic visitors, sign-ups from entry sessions| Article | Organic visitors | Avg time | Continue | Sign-ups | Decision |
|---|---|---|---|---|---|
| Event tracking guide | 8,420 | 4m 10s | 38% | 96 | Keep |
| Funnel analysis | 3,150 | 3m 45s | 34% | 41 | Update (52% of peak) |
| Industry news post | 11,900 | 0m 40s | 6% | 3 | Leave |
| Old metrics glossary post | 610 | 1m 05s | 12% | 1 | Merge |
| New comparison post | 430 | 3m 20s | 29% | 5 | Too early |
Turn metrics into decisions
| Pattern | Likely cause | Action |
|---|---|---|
| Impressions high, clicks low | Title and description do not match the query | Rewrite title and description |
| Clicks fine, time short, few continue | Content does not answer, or the answer is buried | Restructure; answer first |
| Read well, no actions | No next step for the reader | Add a relevant call to action and links |
| Traffic falling | Outdated or outranked | Update with current facts; check competing pages |
| Two articles split one topic | Overlap | Merge and redirect |
Click-through rate from search is covered in how to calculate CTR; bounce and exit on article pages in bounce rate vs exit rate.
Credit actions fairly
Readers rarely sign up on the article itself. Count actions from sessions that entered on the article, not only those whose last page was the article. A good secondary signal is downstream pageviews: pages viewed later in the same session after the article. A post that sends many readers on to product or pricing pages is doing its job even before anyone signs up.
Spot decay with fixed windows
Content decays slowly, and a month-on-month comparison hides it behind seasonality. Use fixed windows: compare the average of the latest four weeks with the average of the best four weeks in the last quarter. A page now under 70% of its peak is decaying; under 40% is severe. Check whether only search dropped or all channels; if only search, the cause is usually ranking, not interest.
Feed the result back into the content plan alongside the marketing KPIs the content team owns.
Content performance in TapCub
The Pages report shows per URL pageviews, visitors, entries, exits, average time, bounce rate and downstream pageviews (pages). Goals show conversions with a breakdown by entry page, so you can see which articles start converting sessions (goals).
With Google Search Console or Bing Webmaster connected, Search performance shows clicks, impressions, click-through rate and average position by page and query, and marks top-10 pages with below-median click-through rate as the first to fix. Content decay looks at 13 weeks of visitors and compares the peak four-week mean with the latest four weeks: under 40% is severely decaying, under 70% with a downward slope is decaying (SEO & content decay). See also time on page and engagement metrics.
FAQ
What are content performance metrics?
Measures of whether content gets found, read, leads to action and keeps its traffic: search impressions and clicks, time on page and continuation, conversions from entry sessions, and traffic trend.
How do you measure content performance?
Pick a fixed window, score each article on the four stages, compare articles of the same type, and turn each pattern into keep, update, merge or remove.
Which metric matters most for blog posts?
There is no single one. For most business blogs, conversions from sessions that started on the post, read alongside time on page and search clicks.
How do I know if content is decaying?
Compare the latest four weeks of visitors with the best four weeks in the last quarter. Below 70% of the peak is a decline worth checking.
Are page views a good content metric?
Only for reach. Page views do not show whether people read, acted or came back.
Was this article helpful?
We use your answers to fix and expand this page.
Couldn’t send. Please try again in a minute.
Thanks for the feedback. We’ll use it to improve this page.You’ve already sent feedback on this page. Thanks.

Product Experience Specialist
Explores usability, user journeys, and feature adoption through practical examples of onboarding and everyday product use.