Try it on your own data
Every report in this article is in the free plan. One snippet for web and apps, up to 10 sites.
Start freeMost marketing KPI lists run to thirty items, and most of those items are metrics nobody is judged on. This guide builds marketing KPIs as a tree from revenue down to each channel, gives every owner one primary KPI, keeps platform-reported numbers apart from outcomes measured on your site, and sets a review cadence.
What you will learn
- A KPI is a metric with a target and an owner that connects to revenue
- Build a KPI tree from the outcome down so trade-offs between traffic and rates are visible
- Measure KPIs on your own site with one attribution rule; keep platform numbers for optimisation
What makes a marketing KPI
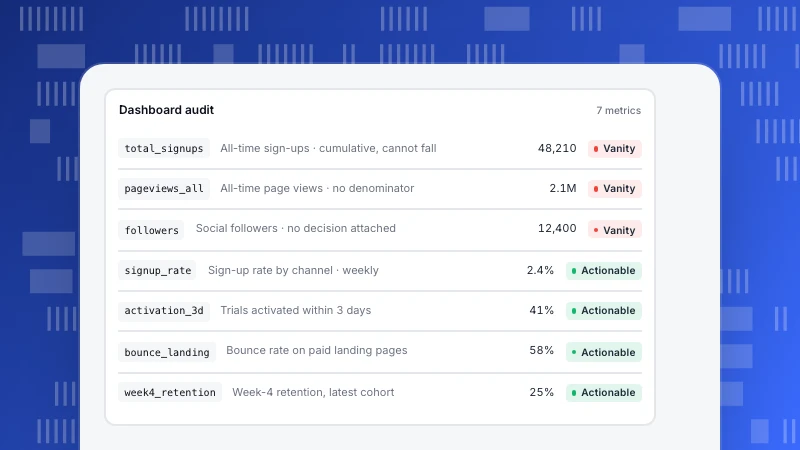
A marketing KPI is a number the marketing team commits to moving, with a target and an owner. Marketing metrics are everything else you can measure. Most lists of 30 or 35 marketing KPIs are really lists of metrics: impressions, likes, open rates, followers. They are useful to the people running a channel, but they are not what the business judges marketing on.
The test is simple: if the number goes up and revenue does not follow, it was a metric, not a KPI. The actionable metrics test helps sort them.
Build a marketing KPI tree
A KPI tree starts at the outcome and breaks it into the inputs that produce it. For a business that sells online, revenue from new customers can be written as:
new revenue = visitors × sign-up rate × paid conversion rate × first-order value
Each factor is a KPI one level down, and each of those splits by channel. The table shows the levels. The tree makes trade-offs visible: doubling paid traffic with half the sign-up rate leaves revenue unchanged, and you can see that before spending the money.
| Level | KPI | Split by |
|---|---|---|
| Outcome | New revenue | Month, plan |
| Rate | Paid conversion rate (sign-up → paid) | Channel, plan |
| Rate | Sign-up rate (visitor → sign-up) | Channel, landing page |
| Volume | Visitors | Channel, campaign |
| Cost | Cost per sign-up, CAC, ROAS | Channel, campaign |
| Value | First-order value, ARPU | Channel, plan |
new revenue = visitors × sign-up rate × paid conversion rate × first-order value
One primary KPI per owner
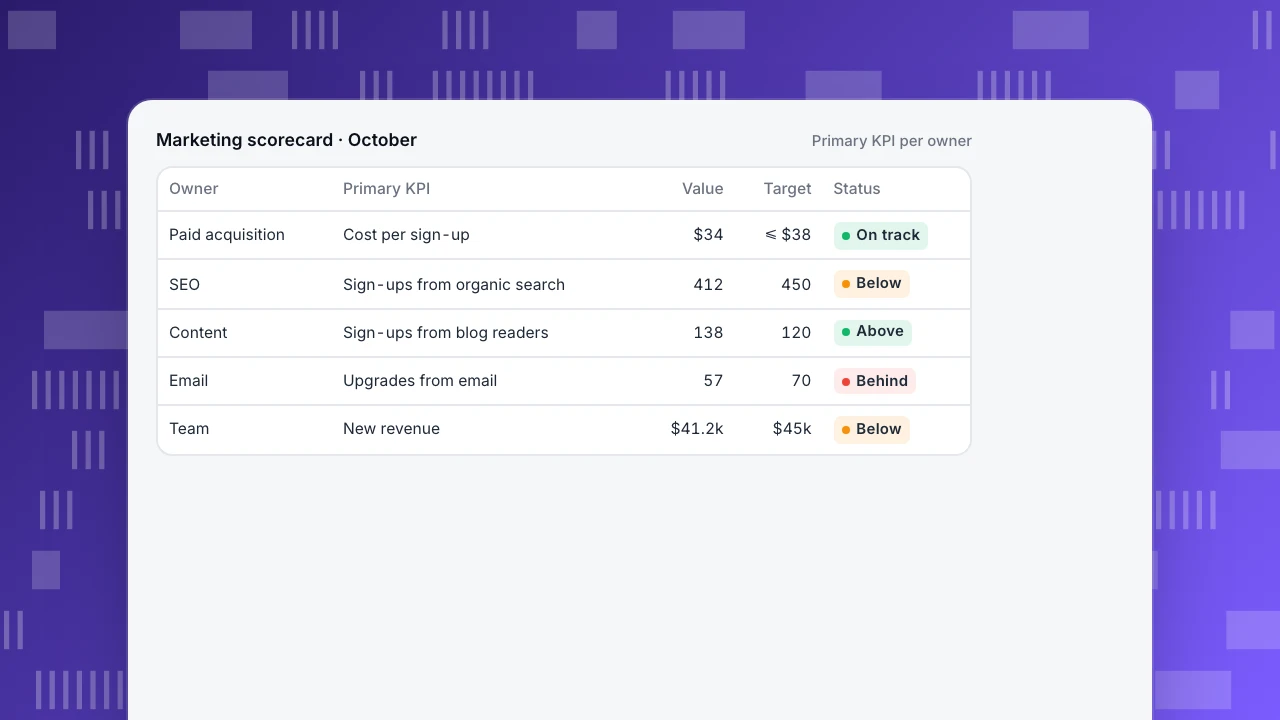
Each channel owner should have one primary KPI that sits in the tree, plus a few supporting metrics they use to run the channel. The example scorecard shows this for four owners. Paid acquisition is judged on cost per sign-up and ROAS, not clicks; SEO on sign-ups from organic search, not rankings; content on sign-ups from readers, not page views; email on sign-ups or upgrades from email, not opens.
Writing it this way also shows where KPIs overlap. If a visitor reads a blog post, gets an email and then signs up through a branded search ad, three owners may claim the same sign-up. Decide the counting rule (first touch, last touch or a shared model) once, and use it for everyone.
Marketing scorecard · October
Primary KPI per owner| Owner | Primary KPI | Value | Target | Status |
|---|---|---|---|---|
| Paid acquisition | Cost per sign-up | $34 | ≤ $38 | On track |
| SEO | Sign-ups from organic search | 412 | 450 | Below |
| Content | Sign-ups from blog readers | 138 | 120 | Above |
| Upgrades from email | 57 | 70 | Behind | |
| Team | New revenue | $41.2k | $45k | Below |
Keep platform numbers apart from site outcomes
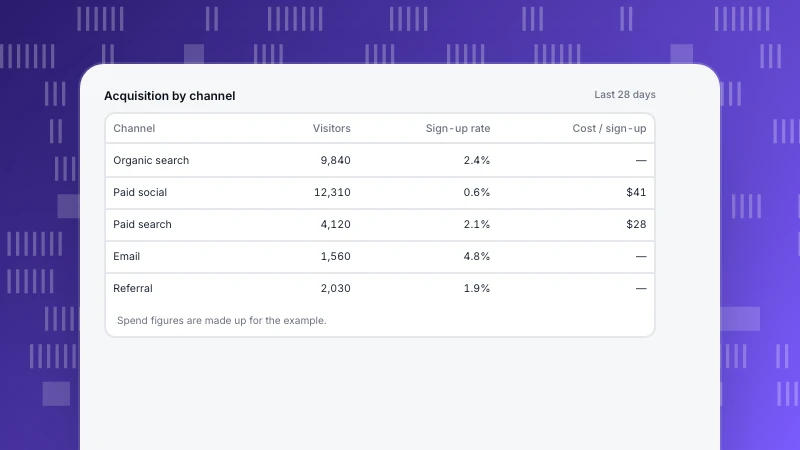
Ad and social platforms report their own conversions, usually with generous attribution windows and view-through credit. Summed across platforms, they often add up to more conversions than you actually had. Keep two layers:
- Platform metrics (impressions, clicks, platform-reported conversions) to optimise inside each platform.
- Site-measured outcomes (sign-ups, purchases by channel) for KPIs, measured once on your own site with one set of rules.
When the two disagree, the site number is the KPI. The platform number is the input for bidding.
Set targets from the tree
Start with the outcome target (for example, new revenue next quarter) and work down. If the sign-up rate and paid conversion rate are stable, the tree tells you how many visitors you need from each channel, and the budget follows from cost per visitor. If the required traffic is unrealistic, the tree shows which rate has to improve instead: often conversion rate on the landing pages, which is cheaper to move than traffic.
Review cadence
- Weekly: channel inputs and sign-ups by channel; act on drops.
- Monthly: CAC and ROAS per channel with spend data; reallocate budget.
- Quarterly: revenue against target; revisit the tree's assumptions.
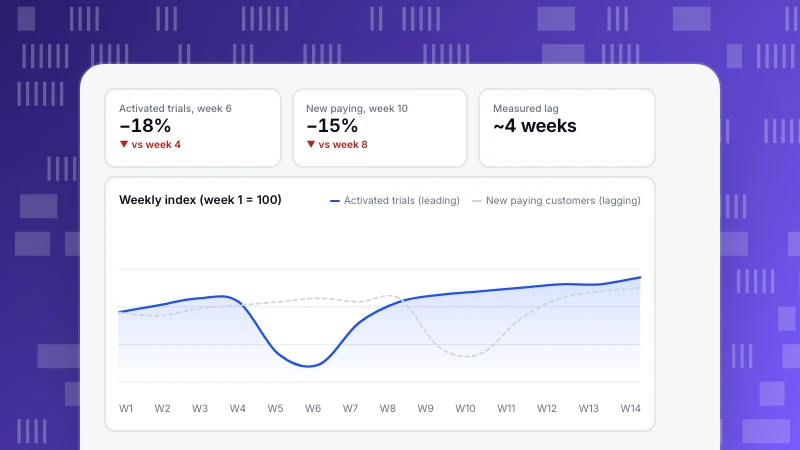
Pair weekly inputs with the monthly outcome they predict, as described in leading vs lagging indicators, and keep the scorecard on one dashboard so every owner reads the same numbers.
Marketing KPIs in TapCub
TapCub measures the site side of the tree. The sources report groups visitors by channel from UTM tags, referrers and ad click IDs, and the channel table includes conversions (sources). Goals turn sign-ups, purchases or any event into conversions with a conversion rate and, if you turn on revenue tracking, a revenue sum per goal (goals).
Every report can be filtered by channel and saved to a dashboard, so each owner's primary KPI can sit on one shared board. Spend and platform metrics stay in the ad platforms; combine them with TapCub's sign-ups by channel to get cost per sign-up. More on the marketing role page and in acquisition metrics.
FAQ
What are marketing KPIs?
Numbers the marketing team commits to moving, with targets and owners, that connect to revenue: for example sign-ups by channel, cost per sign-up, CAC, ROAS and revenue from new customers.
What is the difference between marketing metrics and KPIs?
All KPIs are metrics, but only a few metrics are KPIs. Metrics help run a channel; KPIs are what the business judges marketing on.
How many marketing KPIs should a team have?
One primary KPI per channel owner and one or two outcome KPIs for the team. Supporting metrics can be many, but they should not be on the shared scorecard.
Should I trust conversions reported by ad platforms?
Use them to optimise inside each platform, but measure KPIs on your own site with one attribution rule, because platform totals often overlap.
How often should marketing KPIs be reviewed?
Channel inputs weekly, cost and return monthly, revenue against target quarterly.
See also: Product vs marketing analytics.
Was this article helpful?
We use your answers to fix and expand this page.
Couldn’t send. Please try again in a minute.
Thanks for the feedback. We’ll use it to improve this page.You’ve already sent feedback on this page. Thanks.

Growth Strategist
Explores acquisition channels, activation, and conversion experiments, turning data insights into actionable growth hypotheses and evaluation methods.