Try it on your own data
Every report in this article is in the free plan. One snippet for web and apps, up to 10 sites.
Start freeAsk three teams for their product adoption rate and you will get three numbers, because each picked a different denominator and a different idea of "adopted". This guide separates adoption from activation, measures feature adoption in four dimensions and shows how to choose denominators that do not mislead, including for B2B accounts.
What you will learn
- Adoption is repeated use of core value after activation, not sign-ups or logins
- Measure feature adoption by breadth, depth, frequency and duration
- State the denominator, and measure B2B adoption per account as well as per person
Product adoption is not activation
Activation is a moment: a new user reaches their first real result. Product adoption is a habit: the user keeps getting value from the product, again and again, as part of how they work. A user can activate on day one and never adopt; a product with high activation and low adoption has a good first impression and a weak reason to stay.
So when you measure product adoption, measure repeated use of the things that deliver value, not sign-ups or logins. That requires events for those things, defined in a tracking plan; see the onboarding metrics guide for the activation side.
The four dimensions of feature adoption
Product adoption is the sum of feature adoption, and feature adoption has four dimensions. Looking at only one gives a distorted picture: a feature used by 60% of users once is not adopted; a feature used daily by 3% may be the reason those users pay.
The table shows how to measure each dimension and what question it answers.
| Dimension | How to measure | Question it answers |
|---|---|---|
| Breadth | Users of the feature ÷ active (or eligible) users | How many people use it? |
| Depth | Uses per user, or share of the feature used | How much of it do they use? |
| Frequency | Days used per week or month | Is it part of the routine? |
| Duration | Feature users still using it after N weeks | Do they keep using it? |
Report breadth as the headline, but do not judge a feature on breadth alone.
Read feature adoption side by side
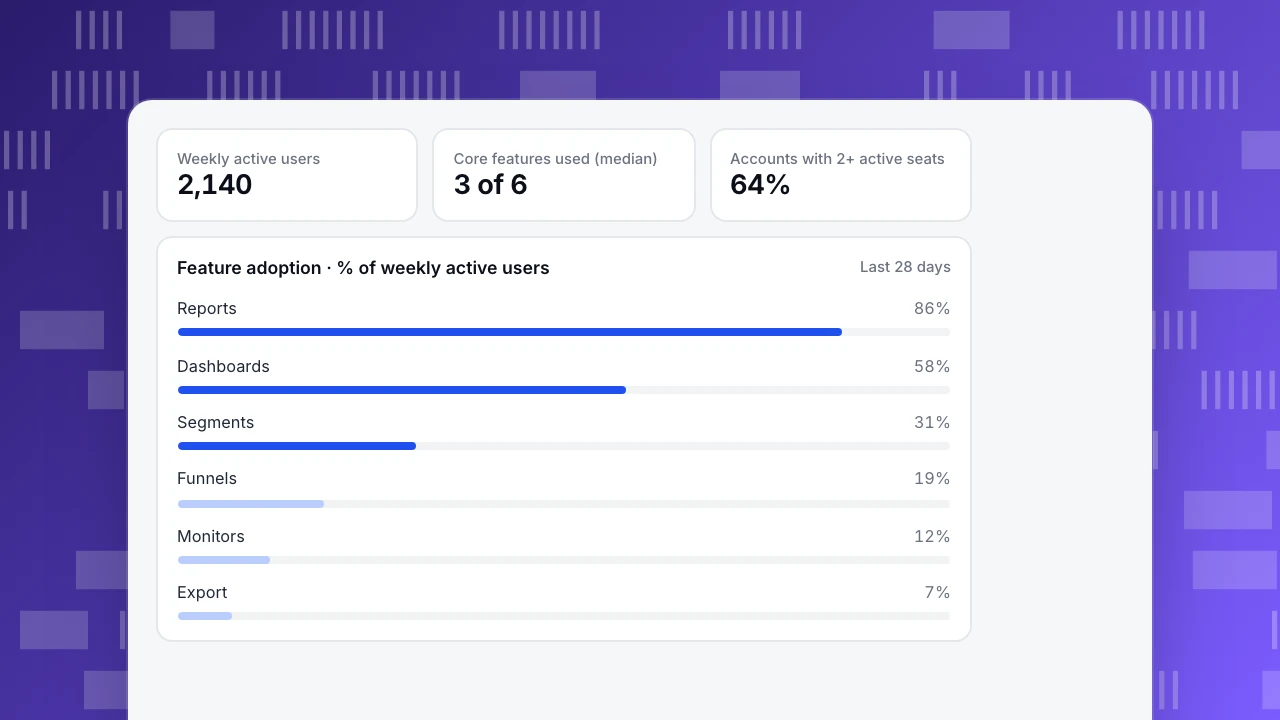
The example shows the share of weekly active users who used each feature in the last 28 days. Reports and dashboards are widely adopted; funnels and exports are used by a minority. That alone does not say whether funnels need work: check frequency and retention for the users who do use them. If funnel users come back more often than everyone else, the job is to get more people to discover funnels, not to change them.
Put the core features at the top and look at the gap between them and the long tail. A product where every feature has 5–10% adoption usually has a discovery problem; one where one feature has 90% and the rest under 5% may be a single-feature product with a big menu.
Weekly active users
2,140
Core features used (median)
3 of 6
Accounts with 2+ active seats
64%
Feature adoption · % of weekly active users
Last 28 daysPick the right denominator
The product adoption rate and feature adoption rate are ratios, and most disagreements about them come from the denominator:
- All sign-ups includes people who never activated. It measures acquisition and onboarding together and drags every adoption rate down.
- Active users in the period answers "of the people using the product, how many use this feature". This is the usual default.
- Eligible users removes people who cannot use the feature (wrong plan, wrong role, wrong platform). Use it for features behind a plan or permission; otherwise a paid feature looks unpopular because free users cannot reach it.
Write the denominator into the metric name ("feature X, % of weekly active Pro users") so the number cannot be misread later.
Measure adoption by account for B2B
In B2B products, the customer is the company, not the person. One power user can hide an account where everyone else has stopped. Measure adoption per account as well: the share of seats active each week, and the number of core features used by at least one person in the account. Falling seat activity in an account with stable revenue is an early churn signal, months before the renewal.
How to measure product adoption, step by step
- List the core features that deliver value (usually 3–7), and define one event for each meaningful use.
- Choose the denominator for each: active users, or eligible users for gated features.
- Measure breadth weekly: users who used the feature ÷ denominator.
- Add depth and frequency for the core features: uses per user, days used per week.
- Check duration with cohort retention of feature users: do they keep using it after week 4?
- Segment by plan, role, platform or account size with segments, and compare.
- Review monthly, alongside engagement metrics such as DAU/MAU for products meant for daily use.
Product adoption in TapCub
TapCub's event analysis covers most adoption measurements without custom queries. An event can be aggregated as total, uniques, average per subject, active percent, sessions or first time; active percent is breadth, average per subject is depth, and first time shows when people start using a feature. Up to 12 measurements can share one chart, broken down by up to three dimensions such as plan or platform (event analysis).
Uniques follow the identity you pick: visitor, device, person or account key. Choosing the account key counts companies instead of people, which is the account-level view for B2B. Retention analysis then shows whether users of a feature keep using it. Event definitions come from your own tracking, described in the event tracking guide.
FAQ
What is product adoption?
Repeated use of a product's core features as part of how someone works, after their first successful use.
How do you calculate product adoption rate?
Users who used the core features in a period divided by active (or eligible) users in the same period. Always state the denominator.
What is feature adoption?
How widely, deeply, often and how long a single feature is used. Breadth (share of users) is the usual headline number.
What is the difference between activation and adoption?
Activation is the first real result. Adoption is repeated use afterwards. High activation with low adoption means users try the product but find no reason to keep using it.
How do you measure adoption in a B2B product?
Per account as well as per person: active seats per week and the number of core features used in each account.
See also: Product adoption dashboard: a template with exact denominators.
Was this article helpful?
We use your answers to fix and expand this page.
Couldn’t send. Please try again in a minute.
Thanks for the feedback. We’ll use it to improve this page.You’ve already sent feedback on this page. Thanks.

Product Adoption Consultant
Explores customer onboarding, live conversations, and self-service, turning common usage questions into practical guidance and improvements.