Try it on your own data
Every report in this article is in the free plan. One snippet for web and apps, up to 10 sites.
Start freeUse this release-review template to decide whether discovery, setup or delivery needs attention. It separates the available audience from first and repeated value.
What you will learn
- Define eligibility, identity and observation windows before rates
- Separate first value from repeat use
- Use the same denominator across nested stages
- Attach an investigation to each signal
A product adoption dashboard shows whether eligible users reach a meaningful outcome and return to achieve it again. Build it around an explicit population, a first-value event, repeat use and cohort retention. A useful dashboard connects each change to a decision; a wall of feature-click totals cannot do that.
Start with one adoption decision
Suppose a collaboration product has launched scheduled reports. The team needs to decide whether to improve discovery, simplify setup or repair delivery. These are different problems. A weekly chart of report clicks cannot separate them, and a general product analytics dashboard contains more information than this release review needs.
Write the decision before choosing the tiles: “For eligible workspaces, where does the journey from access to a second successful report break?” Define successful delivery as the value event, rather than opening the setup screen. This article uses that fictional product throughout. It is a worked design template, not a report about a TapCub customer or a built-in scheduled-report adoption screen.
The UXCam dashboard guide covers goals, metrics, data collection and layout. The narrower template below adds explicit eligibility, fixed observation windows and a decision attached to each stage.
Define the population before the percentage
An adoption rate needs both a numerator and a defensible denominator. For a paid capability, all registered users usually includes people who cannot use it. For a workspace feature, user counts can exaggerate adoption when several colleagues belong to one workspace.
Record these six fields next to the dashboard:
| Definition | Example for the scheduled-report template |
|---|---|
| Counting unit | Workspace, deduplicated by a stable workspace identifier |
| Eligible population | Workspaces with report access when the cohort starts |
| Cohort entry | Access enabled during a specified calendar week |
| First value | A report delivered successfully within seven days of access |
| Repeat value | Another successful delivery on a later day, within fourteen days |
| Exclusions | Internal test workspaces and known synthetic activity |
Keep the eligibility snapshot. If an account upgrades later, place it in the cohort for the date it becomes eligible. Do not silently rewrite an earlier denominator. Explain how cancelled access is treated; either freeze the starting population or report access loss separately. Both can be valid, but they answer different questions.
Use one project time zone and one calendar convention. Deduplicate retries using the business operation identifier before counting deliveries. Where account identifiers or entitlement history are missing, mark the metric unavailable and resolve instrumentation before drawing conclusions.
Use four tiles and one diagnostic table
The first row should let a reviewer distinguish reach, first value and repeated value without scrolling through every event.
| Tile | Calculation | Decision it supports |
|---|---|---|
| Eligible workspaces | Distinct workspaces in the access cohort | Did the available audience change? |
| First-value rate | Workspaces with first successful delivery / eligible workspaces | Is the initial journey working? |
| Repeat among adopters | Workspaces with repeated delivery / first-value workspaces | Is value recurring after initial success? |
| Sustained reach | Workspaces with repeated delivery / eligible workspaces | How much of the audience reaches repeated value? |
Under the tiles, show a stage table for eligibility, discovery, setup and successful delivery. Add a cohort table beside it when there is enough mature data. Do not combine a newly eligible cohort with one that has already had fourteen days to return. Show “awaiting observation” rather than treating incomplete follow-up as failure.
An optional quality row can show unsuccessful delivery attempts and their causes. Keep attempt-based failure rates separate from workspace adoption rates. A workspace retrying ten times is one workspace and ten attempts; neither count is wrong, but substituting one for the other changes the question.
Work through the sample numbers
All figures here are sample data, constructed to make the calculations reproducible. Assume all workspaces have completed the required follow-up window.
| Stage | Workspaces | Share of eligible population | Conversion from prior stage |
|---|---|---|---|
| Eligible | 1,000 | 100% | — |
| Opened report setup | 600 | 60% | 60% |
| Saved a valid schedule | 300 | 30% | 50% |
| Received a successful delivery | 240 | 24% | 80% |
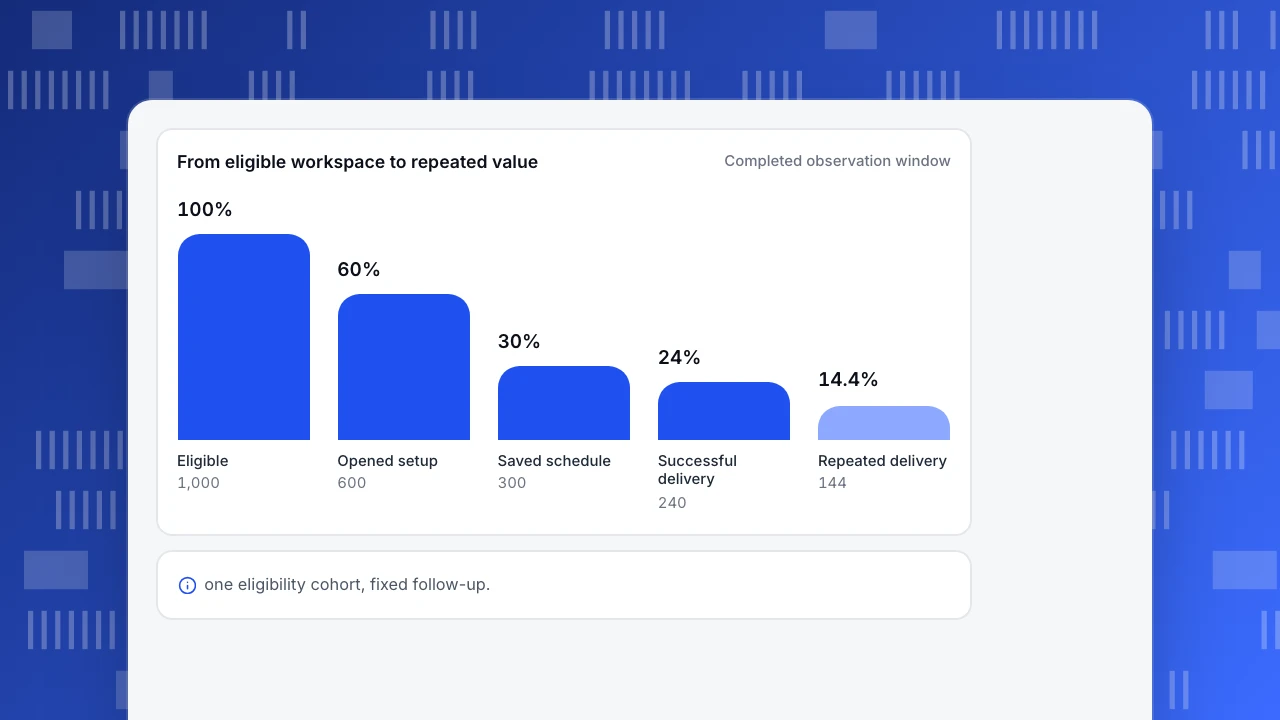
| Received another delivery on a later day | 144 | 14.4% | 60% |
First-value adoption is 240 / 1,000 = 24%. Repeat among adopters is 144 / 240 = 60%. Sustained reach is 144 / 1,000 = 14.4%. Multiplying 24% by 60% gives the same 14.4%, because these stages are nested within the same population and observation rules.
The largest percentage loss is not automatically the task to tackle. Four hundred eligible workspaces never opened setup; some may not need scheduled reports. Three hundred opened setup but did not save a valid schedule; that group is a more direct candidate for usability research. Sixty saved a schedule without receiving a successful delivery; investigate delivery reliability before sending more promotional messages.
Estimate opportunity with explicit assumptions. If setup completion rose from 50% to 60% among the same 600 workspaces, there would be 60 additional schedules. Holding subsequent conversion at 80% would imply 48 additional first-value workspaces. This is a scenario, not a forecast or evidence that a redesign will deliver that gain.
From eligible workspace to repeated value
Completed observation windowEligible
1,000
Opened setup
600
Saved schedule
300
Successful delivery
240
Repeated delivery
144
Segment without creating contradictory dashboards
Start with one actionable split: access cohort, plan or workspace size. Compare like with like. Enterprise workspaces may have longer security reviews; a small team may configure the feature immediately. A blended rate can change simply because the mix changes.
Show the counts with the percentages. “Two of four workspaces adopted” and “500 of 1,000 adopted” share a rate but provide different evidence for planning. Avoid ranking tiny segments by a decimal-place difference. Treat sparse cells as exploratory and seek direct feedback before committing engineering time.
Keep the same first-value definition across segments. If one dashboard counts a setup save and another counts delivery, rename the metrics rather than presenting them as comparable adoption. If the business deliberately changes the definition, annotate the date and avoid interpreting that discontinuity as product improvement.
Account-level and person-level views can coexist. Label them separately: the workspace view tells you whether the customer organization gets value; the person view tells you whether use spreads across its members. One active administrator does not prove broad team adoption.
Turn each signal into a follow-up
Use a small decision log instead of a universal adoption target.
| Observed pattern | Check before acting | Candidate follow-up |
|---|---|---|
| Low discovery, healthy downstream conversion | Is access real and relevant for this cohort? | Test clearer entry points with representative users |
| Setup starts but rarely completes | Validation failures, permissions and task recordings from a study | Remove a specific setup obstacle |
| Schedules save but delivery fails | Delivery status and retry deduplication | Repair reliability and verify recovery |
| First value rises while repeat falls | Follow-up maturity and expected report frequency | Interview adopters who stopped using it |
| Overall rate falls, segment rates stay stable | Changes in plan and workspace mix | Explain composition before proposing a redesign |
These are hypotheses to investigate. Observational dashboards cannot establish that feature use caused retention. Compare similarly aged cohorts and account types, and use an appropriate experiment outside the dashboard if causal evidence is necessary. See correlation versus causation.
Assemble the analyses in TapCub
Begin with the documented event builder at All-platform analytics › Behavior › Event analysis. Use event analysis for counts and trends; use a funnel for the ordered setup journey; use retention for a defined return event. Save analyses before adding them to a dashboard. The analysis guide explains model selection and identity constraints.
The dashboard design here is a measurement specification. It does not imply that entitlement history or a custom workspace-level metric appears automatically in TapCub. Send the business events and identifiers your model needs, verify the available account identity configuration, and calculate unsupported joins in your own governed dataset. Account identity also has different follow-up actions from person identity; do not assume every result supports creating a user segment.
For event selection and eligibility details, use the separate guides to measuring product adoption and feature adoption. Keep this dashboard focused on the release decision.
FAQ
What should a product adoption dashboard include?
Include eligible users or accounts, first meaningful use, repeated meaningful use, an observation window and a diagnostic journey. Add counts, freshness and a short definition to every rate. Revenue and satisfaction can be supporting evidence, but they do not replace a direct value event.
Is adoption the same as logging in?
No. Logging in establishes access or activity. Adoption concerns the outcome that makes the feature useful. For this template, delivery counts as first value; merely opening the scheduling screen does not.
Should I count users or accounts?
Choose the unit that matches the decision. Count accounts for a shared organizational workflow, and users for individual behavior. If both matter, publish separate views with their own denominators and explain how users map to accounts.
How often should the dashboard update?
Match refresh timing to the action it supports and the upstream data. Display the last successful refresh and the data-through time. A weekly adoption decision rarely benefits from an apparently live number whose deliveries have not finished processing.
Sources and next step
Sources checked on November 7, 2026: UXCam: product adoption dashboards and TapCub: choosing an analysis. The sample population, calculations and decision tables were created for this article; they are not customer results or industry benchmarks. Start by documenting one eligible population and one value event, then build the first-value and repeat-use views.
Was this article helpful?
We use your answers to fix and expand this page.
Couldn’t send. Please try again in a minute.
Thanks for the feedback. We’ll use it to improve this page.You’ve already sent feedback on this page. Thanks.

Product Analyst
Focuses on event analysis, conversion funnels, and retention, using clear metric definitions and structured analysis to explain product performance.