Try it on your own data
Every report in this article is in the free plan. One snippet for web and apps, up to 10 sites.
Start freeShipping a feature is the start, not the finish. This guide breaks feature adoption into five measurable stages, gives a formula for each metric, and walks through a launch where the dashboard said 19.5% adoption but only 5.9% of eligible users made the feature a habit, and why fixing setup beat sending more announcements.
What you will learn
- Define eligible users before quoting an adoption rate
- Measure exposure, first success, repeat use and habit separately
- Count the value event, not the click on the entry point
- Fix the stage with the biggest loss before adding prompts
- Adopter vs non-adopter retention gaps are not causal proof
What is feature adoption?
Feature adoption is the process by which users discover a specific feature, try it, and make it a regular part of how they use your product. It is narrower than product adoption, which asks whether people adopt the product as a whole. Feature adoption asks the same question one capability at a time: did the people who could benefit from scheduled reports, bulk edit or the new dashboard actually start relying on them?
It matters because most product effort goes into features, and most features are used by few people. Pendo's analysis of its customers' products found that about 80% of features are rarely or never used. Measuring adoption per feature tells you which work paid off, which needs better onboarding, and which should be removed.
The feature adoption funnel
Adoption is a sequence, not a single event. Measure each step separately:
| Stage | Definition | Typical event |
|---|---|---|
| Eligible | Users who could use the feature (right plan, role, platform) | Active users on a qualifying plan |
| Exposed | Saw the entry point | feature_viewed or a pageview of the feature page |
| Activated | Used it once successfully | report_scheduled (the value event, not the click) |
| Repeated | Used it again within a set window | Second success within 14 days |
| Adopted | Uses it habitually | Used in 3 of the last 4 weeks |
Define the denominator first. "20% adoption" means nothing until you say 20% of whom.
Feature adoption metrics and formulas
| Metric | Formula | What it answers |
|---|---|---|
| Feature adoption rate | Users who used the feature ÷ eligible active users | How widely is it used? |
| Discovery rate | Users exposed ÷ eligible users | Do people find it? |
| Activation rate | Users who succeeded once ÷ users exposed | Is it understandable? |
| Time to adopt | Median days from first exposure to first success | How much friction is there? |
| Feature retention | Users using it in week N ÷ users who first used it in week 0 | Does it stick? |
| Usage depth | Uses per adopting user per week | How central is it for those who adopt? |
| Core adoption | Users meeting the habitual threshold ÷ eligible users | Is it part of the routine? |
| Metric | Formula |
|---|---|
| Adoption rate | Users of feature ÷ eligible active users |
| Activation rate | First success ÷ exposed |
| Time to adopt | Median days, exposure → first success |
| Feature retention | Week-N users ÷ week-0 first users |
| Core adoption | Habitual users ÷ eligible users |
Always state the denominator and the time window.
Worked example: scheduled reports
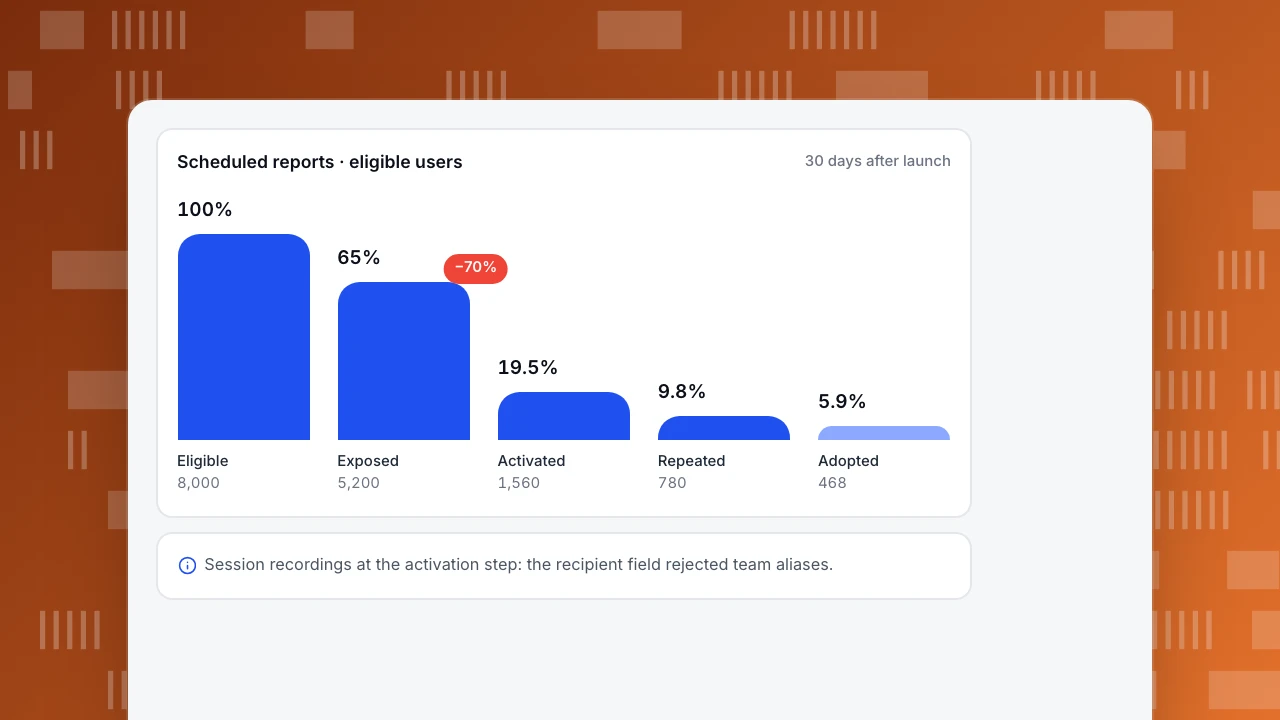
A B2B analytics product ships scheduled email reports. In the 30 days after launch (sample data):
| Stage | Users | % of eligible | Step conversion |
|---|---|---|---|
| Eligible (paid plans, active) | 8,000 | 100% | — |
| Exposed (opened the schedule dialog) | 5,200 | 65% | 65% |
| Activated (saved a schedule) | 1,560 | 19.5% | 30% |
| Repeated (opened a report email, edited or added a schedule within 14 days) | 780 | 9.8% | 50% |
| Adopted (active schedule in 3 of 4 weeks) | 468 | 5.9% | 60% |
What the numbers say:
- Discovery is fine. 65% found the dialog in a month.
- Activation is the bottleneck. 70% of people who opened the dialog left without saving. Session recordings showed the recipient field rejected team aliases; fixing it is the highest-leverage change.
- Headline vs real adoption. The launch dashboard reported "19.5% adoption" (tried once). Habitual use is 5.9%. Both are true; only the second predicts value.
- Stickiness after activation is healthy. 60% of repeaters kept a schedule running, so the feature works for people who get past setup.
Do adopters retain better? Accounts with an active schedule renewed at 92% versus 81% for the rest. Tempting, but not proof: engaged accounts are more likely both to set up schedules and to renew. To estimate the feature's own effect, compare accounts with similar activity before launch, or run a holdout for the onboarding prompt. See correlation vs causation.
Scheduled reports · eligible users
30 days after launchEligible
8,000
Exposed
5,200
Activated
1,560
Repeated
780
Adopted
468
How to increase feature adoption
- Fix the step with the biggest loss first. Above, that is activation, not awareness. More announcements would not help.
- Put the entry point where the need appears. Offer "schedule this report" on the report people already export every Monday, not in a settings menu.
- Shorten the happy path. Sensible defaults, prefilled recipients, one-click templates.
- Use contextual, targeted prompts. Show them to eligible users who have the problem (exported the same report three times), not to everyone.
- Follow up after first use. A confirmation that the first report was delivered, with a link to adjust it, drives the repeat step.
- Learn from power users. Interview the 468 adopters: what did they use it for, what nearly stopped them? See power user.
- Retire what nobody adopts. A feature with low adoption after fixes still costs maintenance and adds clutter.
Common mistakes
- Counting clicks instead of success. Opening a dialog is exposure, not adoption.
- Using all users as the denominator when only paid plans can use the feature.
- Reading launch week as the steady state. Novelty spikes; measure at 30, 60 and 90 days.
- Declaring causal impact from adopter vs non-adopter comparisons (self-selection).
- Measuring without a tracking plan. If exposure and success events are not defined before launch, you will not get the funnel afterwards. See tracking plan.
Measuring feature adoption in TapCub
- Send one event for exposure and one for success with custom events, or use autocaptured clicks for the entry point.
- Build the stages as a funnel restricted to eligible users with a segment (plan, role).
- Use retention with the first success as the start event and the same event as the return event to get feature retention; use active-days distribution for depth.
- Add the feature's success event to the core events of the product engagement score (Business › Product engagement) so its adoption counts toward the score's adoption part.
See also: Product life cycle, Product engineer.
See also: Product analytics examples.
See also: Product feature analysis: a matrix for keep, improve or retire.
Sources
- Pendo (2019). The 2019 Feature Adoption Report.
- Rogers, E. M. (2003). Diffusion of Innovations, 5th ed. Free Press.
- Nielsen Norman Group. Feature discoverability.
Was this article helpful?
We use your answers to fix and expand this page.
Couldn’t send. Please try again in a minute.
Thanks for the feedback. We’ll use it to improve this page.You’ve already sent feedback on this page. Thanks.

Product Adoption Consultant
Explores customer onboarding, live conversations, and self-service, turning common usage questions into practical guidance and improvements.