Engagement
25 articles tagged “Engagement”. Tags cut across categories, so you may find analytics, chat and product notes side by side.
Tagged Engagement
25 articles
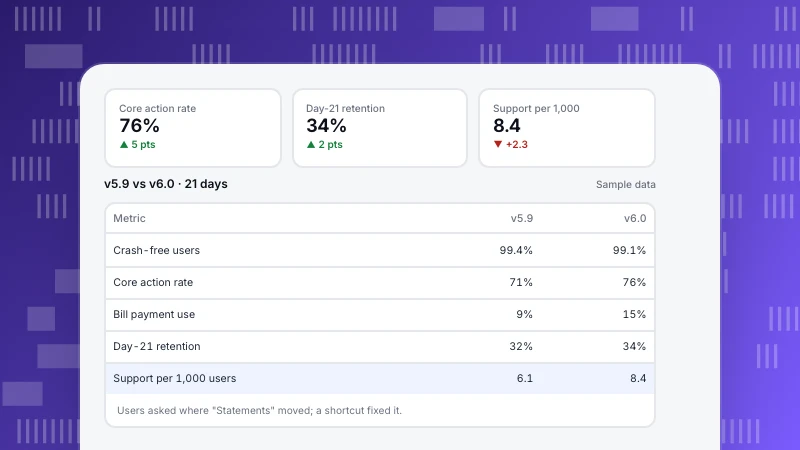
App redesign: when to do it and how to measure it
How to redesign an app with evidence: signals that justify a redesign, eight steps including staged rollout and version comparison, a navigation redesign example and mistakes.
Read more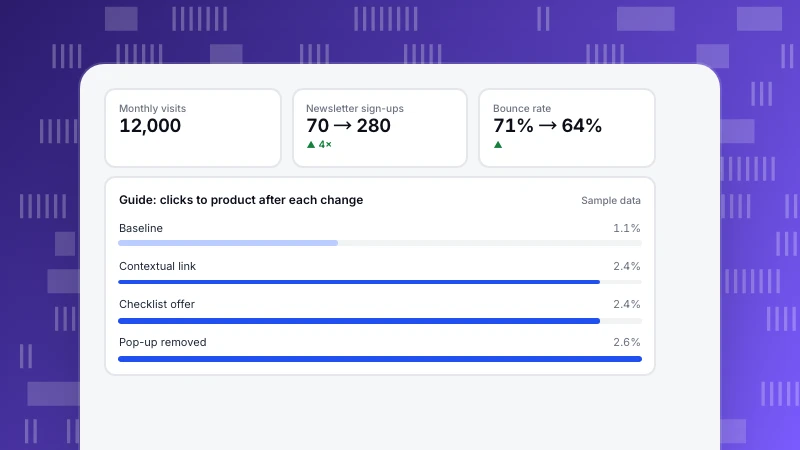
How to improve website engagement: metrics and 12 tactics
Improve website engagement by defining the next meaningful step per page type. Metrics to track, 12 tactics, a four-step process and a guide example.
Read more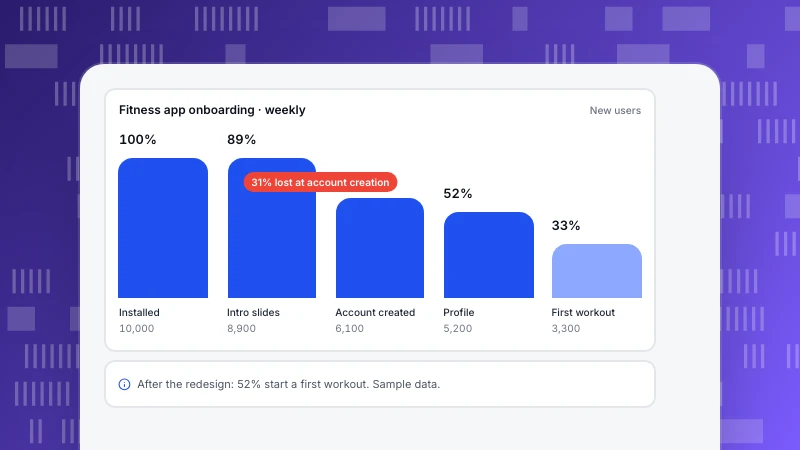
App onboarding: flow types, best practices and how to measure them
App onboarding gets new users to their first moment of value. Five flow types, ten best practices, the metrics to track and a fitness app example that lifted first-workout starts from 33% to 52%.
Read more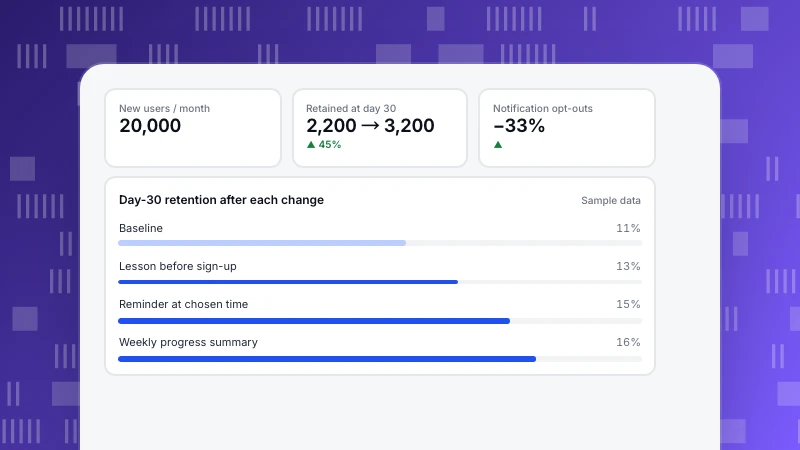
How to increase mobile app engagement: metrics and 10 tactics
Increase mobile app engagement by defining a core action, measuring stickiness and retention, and applying ten tactics. A five-step plan and a language-learning app example.
Read more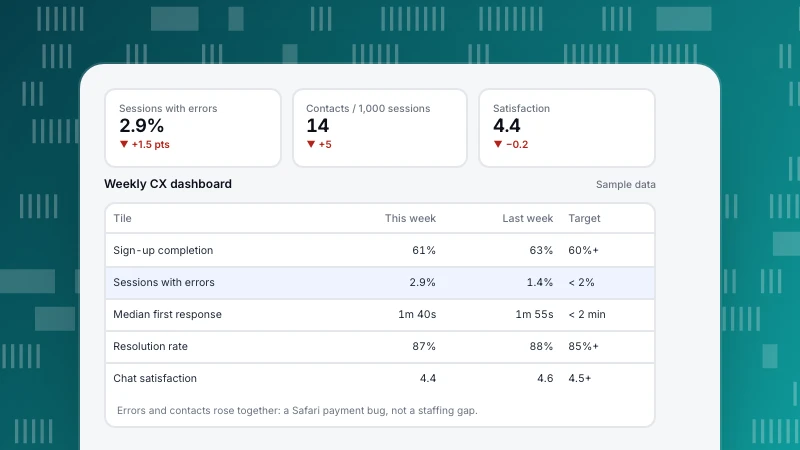
Customer experience dashboard: metrics, layout and examples
What to put on a customer experience dashboard: digital experience, support, satisfaction and outcome metrics, five steps to build one, an example layout and common mistakes.
Read more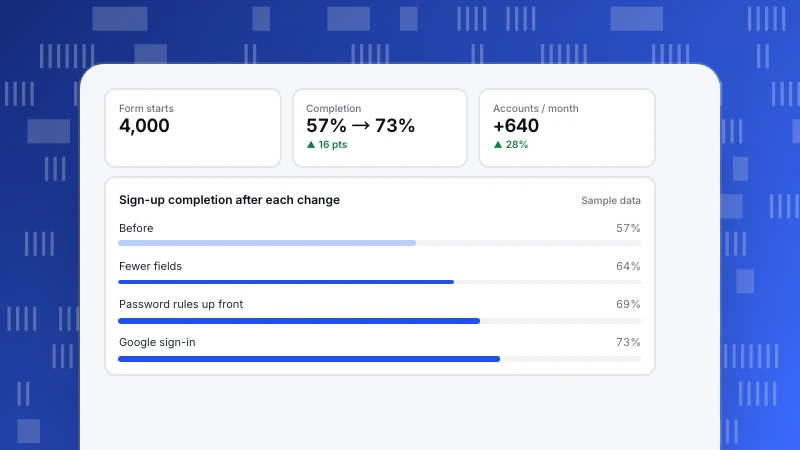
UX optimization: how to improve user experience with data
UX optimization finds where users struggle and removes the friction, one measured change at a time. The metrics to track, ten techniques, the optimization loop and a sign-up form example.
Read more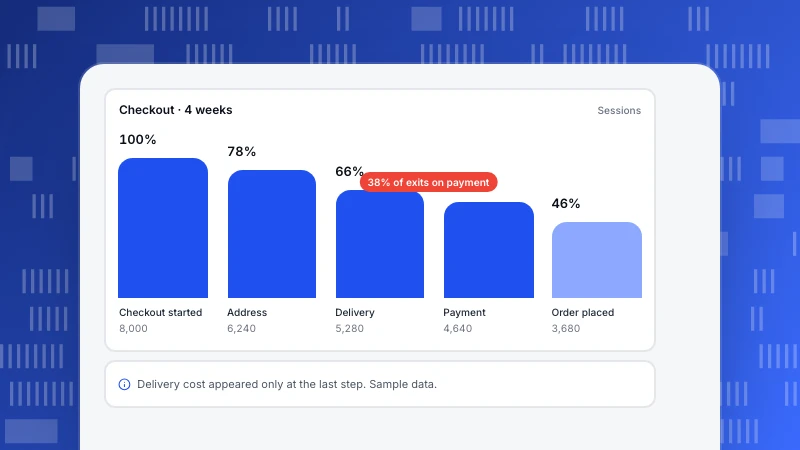
UX audit: how to do one in 7 steps (with checklist)
A UX audit finds usability problems and ranks what to fix. Expert review vs data-driven review, seven steps, a measurable checklist, a checkout audit example and FAQ.
Read more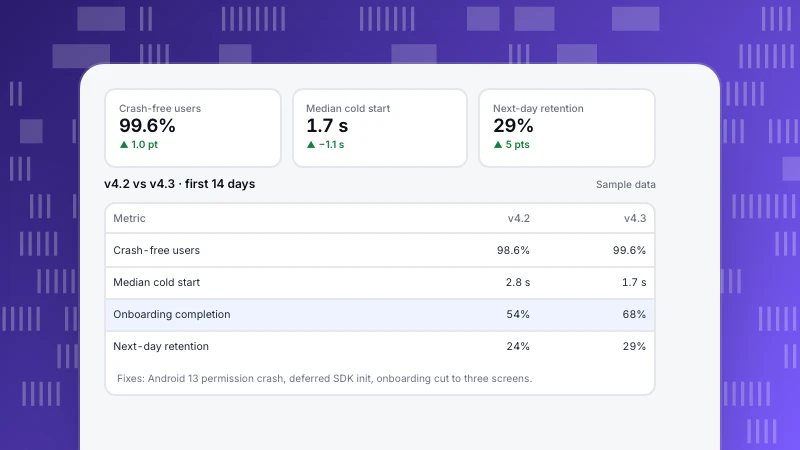
Mobile app optimization: stability, onboarding, conversion and store
Mobile app optimization across four areas: stability and performance, onboarding and engagement, conversion and store visibility. A seven-step process, a version comparison example and common mistakes.
Read more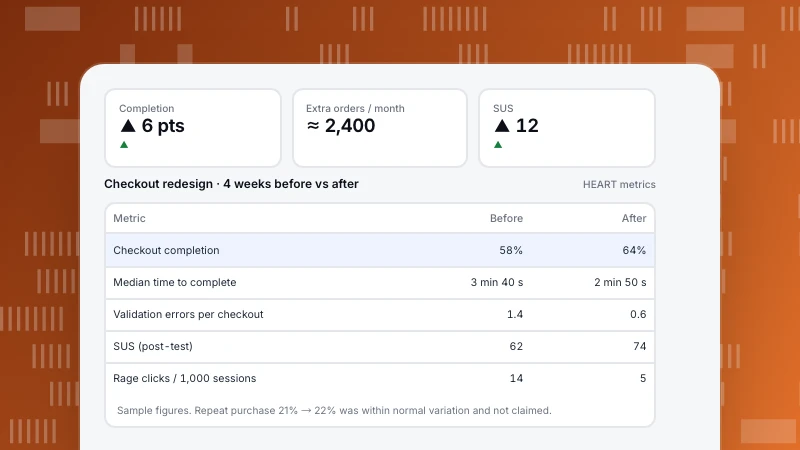
UX metrics: what to measure, the HEART framework and a worked redesign
The UX metrics that matter, behavioral and attitudinal, with how to measure each; Google’s HEART framework with goals, signals and metrics; and a worked checkout redesign measured before and after.
Read more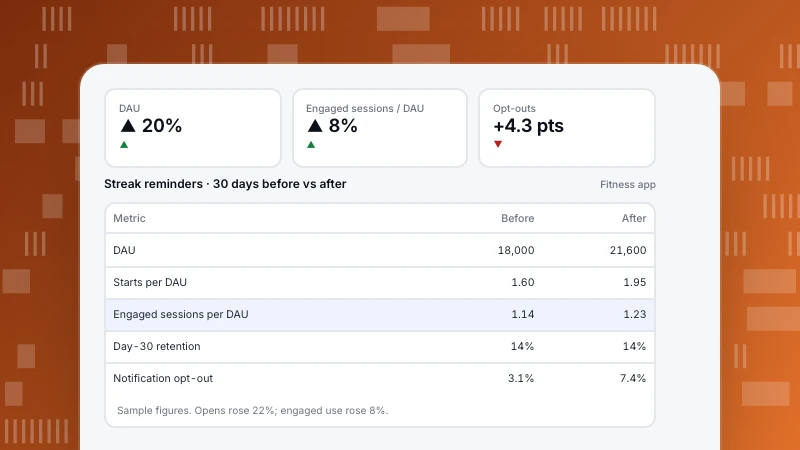
App engagement metrics: formulas, benchmarks by app type and a worked case
The app engagement metrics that matter, with formulas: DAU, MAU, stickiness, session length and interval, engaged sessions and retention. How to judge them by app type, and a worked case where opens rose 22% but real use barely moved.
Read more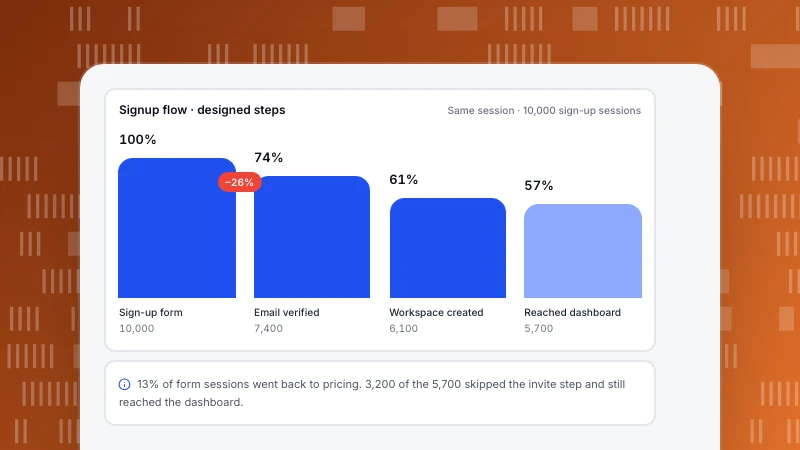
User flow: how to create one, examples and how to check it against real paths
What a user flow is, how it differs from a user journey and a wireflow, six steps to create one, four examples, and a worked signup flow compared with the paths 10,000 sessions actually took.
Read more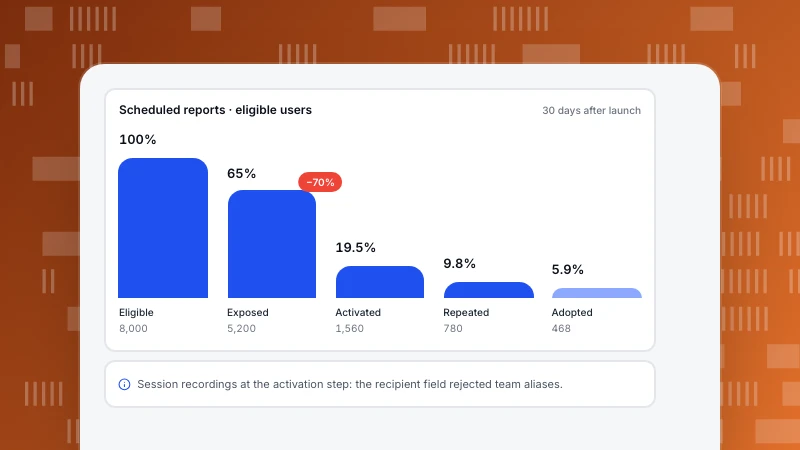
Feature adoption: the funnel, metrics and how to increase it
Feature adoption is whether users find, try and keep using a specific feature. The five-stage funnel, formulas for each metric, a worked example where 19.5% tried a feature but 5.9% adopted it, and tactics that target the real bottleneck.
Read more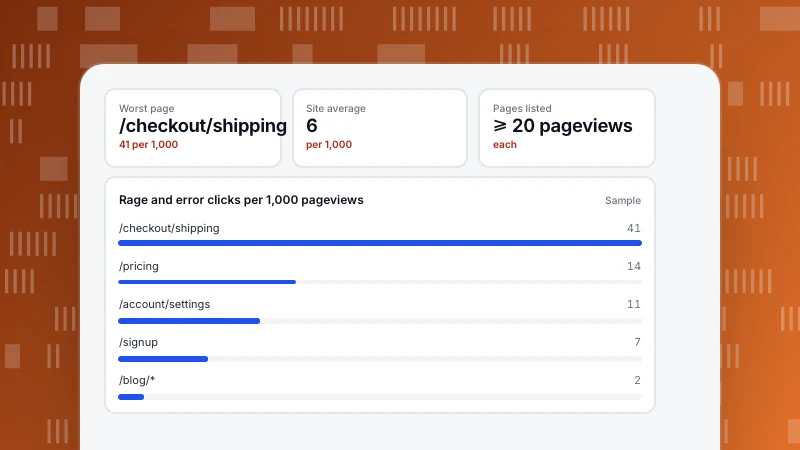
User Friction: How to Find It in Your Data and Fix It
User friction is anything that slows people down or stops them reaching their goal. The signals that reveal it in behaviour data, a sample where rage clicks pointed to the fix, and a routine for ranking friction points.
Read more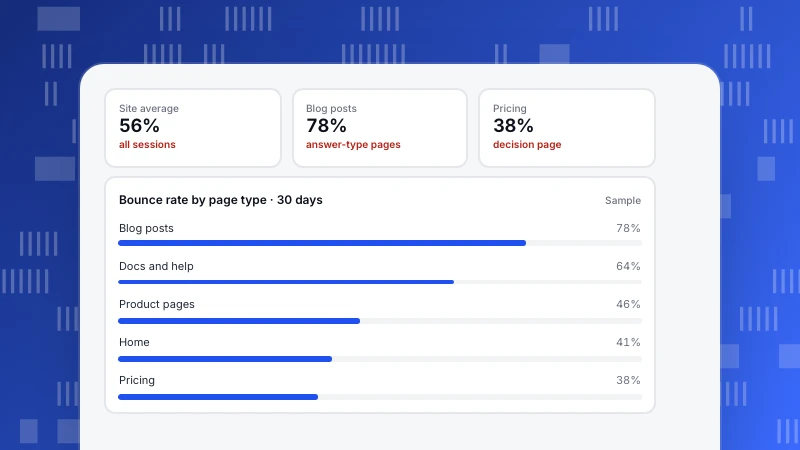
What Is a Good Bounce Rate? Judge It by Page Type, Not One Number
There is no single good bounce rate. What bounce rate measures, why a site-wide average misleads, a sample by page type, when a high rate is a real problem, and how to set your own target.
Read more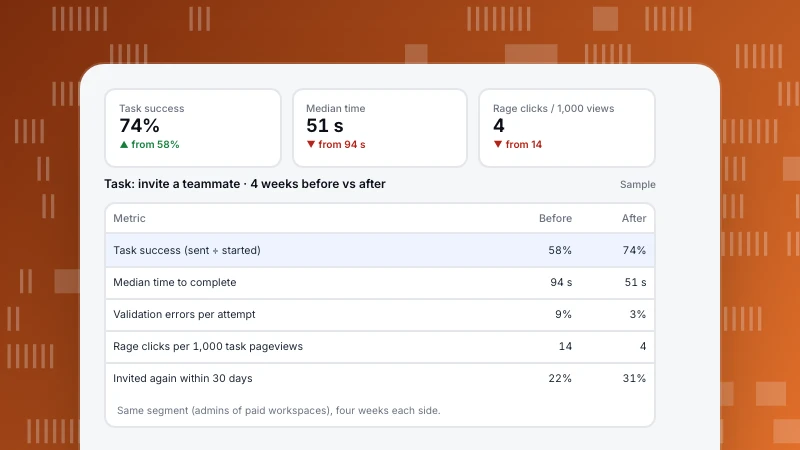
UX Analytics: Measure Whether a Task Got Easier
UX analytics uses behaviour data to measure how easy it is for people to complete tasks in your product or site. Five task metrics, how to define them in events, and a before-and-after example of a redesigned flow.
Read more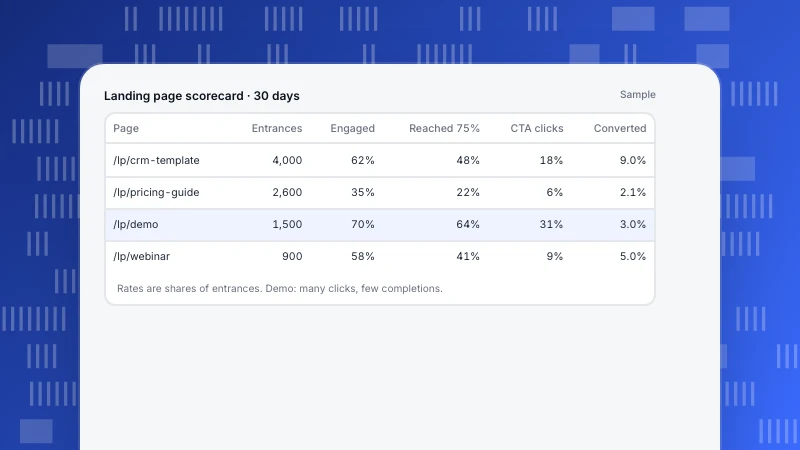
Landing Page Analytics: A Six-Metric Scorecard That Shows Where Visitors Drop
Landing page analytics should tell you where on the page visitors are lost, not just how many converted. Six metrics in page order, a sample scorecard of four pages, and the patterns that point at the fix.
Read more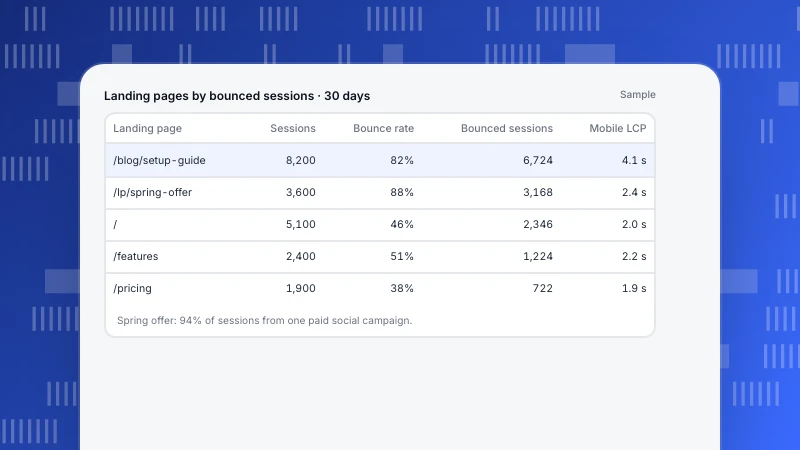
How to Reduce Bounce Rate: Find the Pages That Matter, Then Fix the Cause
Reducing bounce rate starts with knowing what your tool counts as a bounce and which pages lose the most visitors. How to rank landing pages, diagnose the cause by source and device, and apply the fix that matches it.
Read more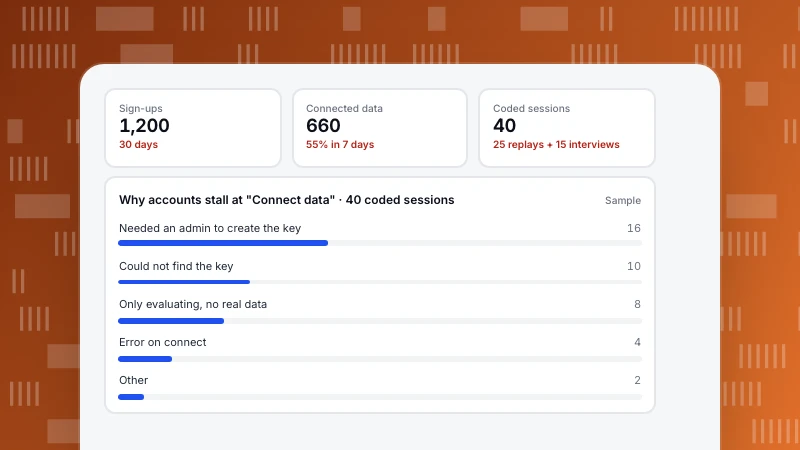
Qualitative vs Quantitative Data: What Each Tells You, and How to Use Both
Quantitative data counts and measures: how many, how often, how much. Qualitative data describes: why, how it felt, what people expected. A comparison table and a product example where numbers find a drop and interviews explain it.
Read more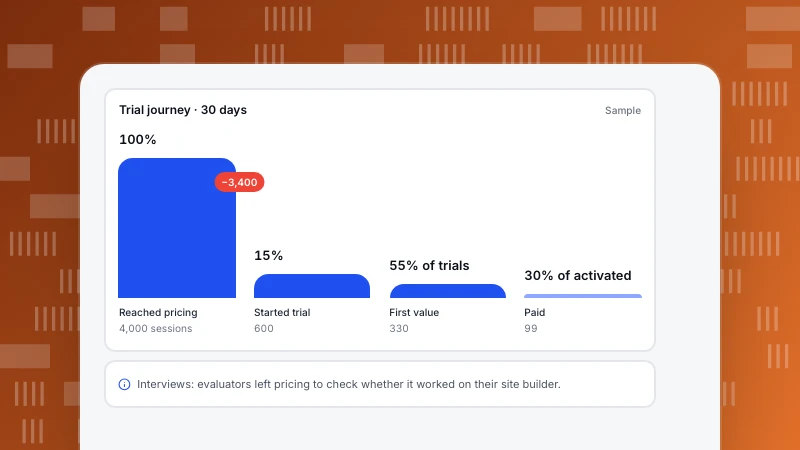
How to Create a Customer Journey Map That Uses Real Data
A customer journey map lays out the stages a customer goes through, what they do and feel at each one, and where they get stuck. Six steps to build one from research and analytics, with a filled-in SaaS example.
Read more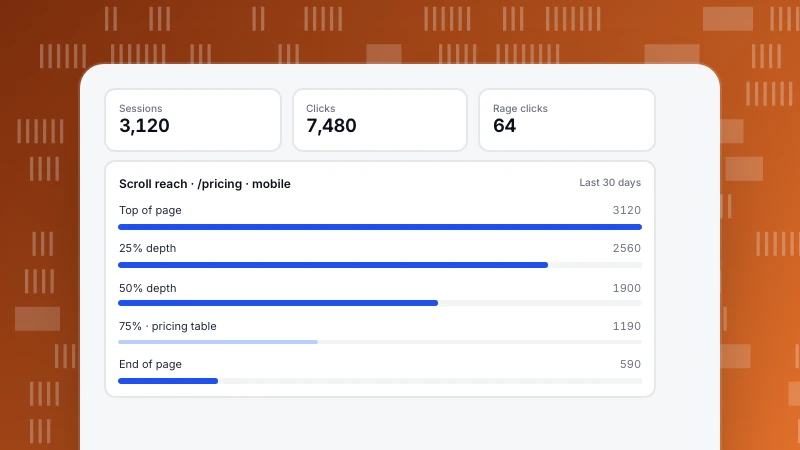
How to Read a Heatmap: Clicks, Rage Clicks and Scroll Reach
How to read a heatmap: colour is relative density, so check the legend and the base first. Then website heatmaps one by one (clicks, rage clicks, scroll reach, elements) and the checks to run before changing a page.
Read more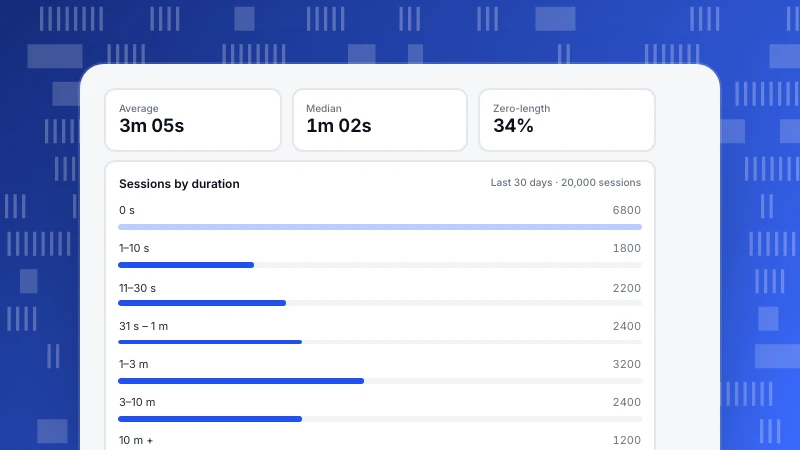
Average Session Duration: How It's Calculated and Why the Mean Misleads
Average session duration is the last event minus the first, averaged over sessions. Why one-page sessions often count as zero, how a few long sessions inflate the mean, and how to read it as a distribution instead.
Read more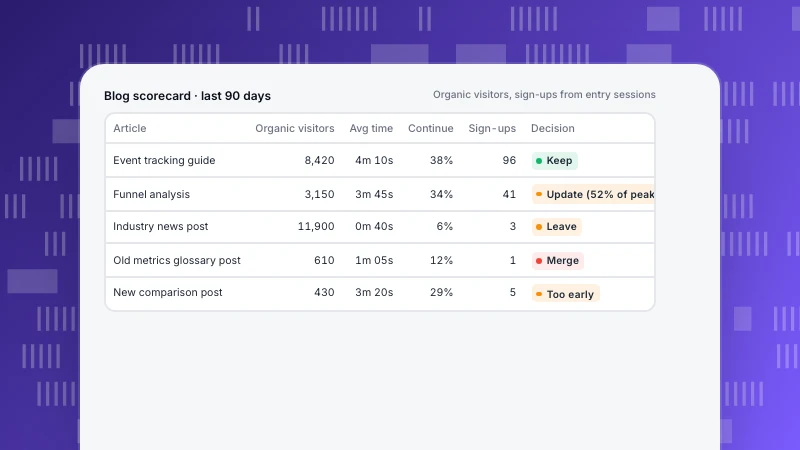
Content Performance Metrics: Score Each Article in Four Stages
Content performance metrics grouped into four stages for each article (found, read, acted, lasted), a scorecard that turns them into keep, update, merge or remove decisions, and a fixed-window check for decay.
Read more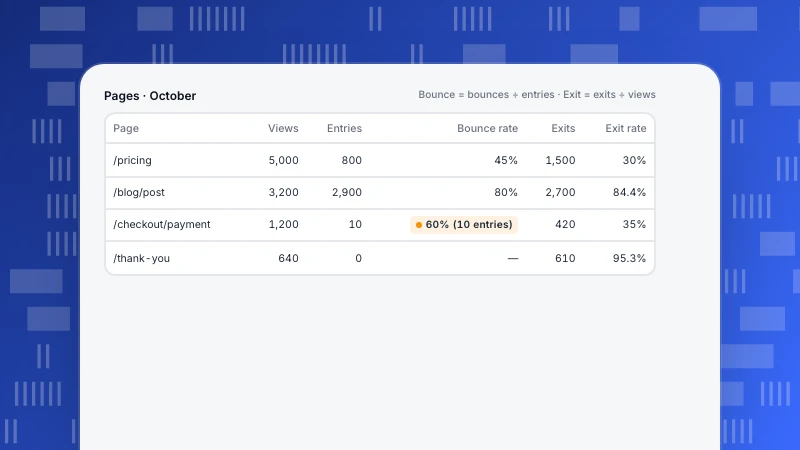
Bounce Rate vs Exit Rate: Different Denominators, Different Questions
Bounce rate divides single-page sessions by sessions that started on a page; exit rate divides exits by every view of that page. A worked table, which pages each one fits, and the mistakes to avoid.
Read more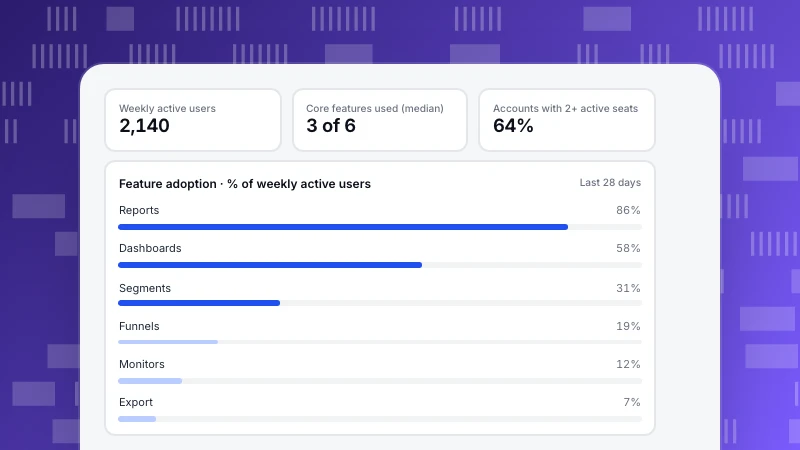
How to Measure Product Adoption, Feature by Feature
How to measure product adoption with events: how it differs from activation, the four dimensions of feature adoption, choosing the right denominator, and account-level adoption for B2B products.
Read more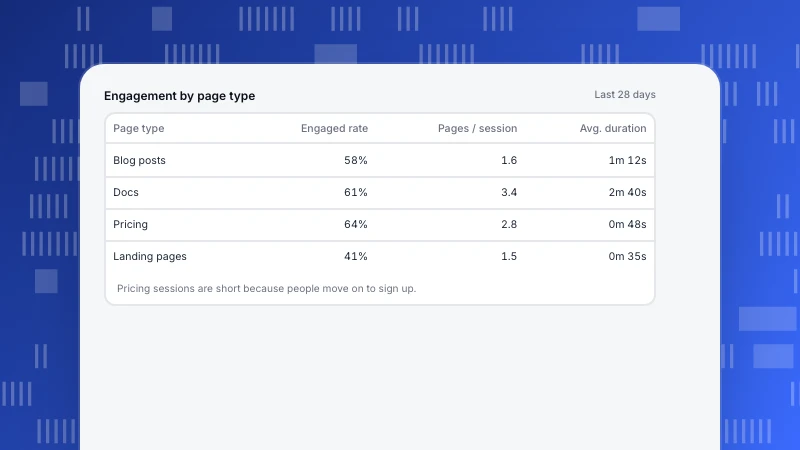
Engagement Metrics: What to Measure on a Site and in a Product
Engagement metrics for websites and products with formulas and blind spots, how engaged sessions are counted, and how to raise user engagement without gaming the number.
Read more