Try it on your own data
Every report in this article is in the free plan. One snippet for web and apps, up to 10 sites.
Start freeUX optimization is the continuous process of finding where people struggle on a site or app and removing that friction. This guide lists the UX metrics worth tracking, ten techniques that reliably improve user experience, the measure-change-measure loop, and a sign-up form where three separate changes lifted completion from 57% to 73%.
What you will learn
- Judge UX by completion, time, errors and support contacts
- Find the biggest friction point with funnels, then see why with replays
- Write a hypothesis before changing anything
- Change one thing and measure on matching days
- Speed and accessibility are part of UX
What is UX optimization?
UX optimization (user experience optimization) is the continuous process of finding where people struggle on a website or app and removing that friction, so they reach their goal faster and more often. It is data-led: you measure a baseline, find the biggest friction point, change one thing, and measure again. Where a UX audit is a one-off review, UX optimization is the loop that keeps running after it.
Good UX optimization improves outcomes you can count: task completion, conversion, time to complete, errors, support contacts and retention. "Looks cleaner" is not a result.
Why improving user experience pays off
- Friction compounds. Each confusing step loses a share of users, and a flow with five steps multiplies those losses.
- Speed is part of UX. Slow responses and layout shifts are among the most common complaints, and they are measurable.
- Support costs fall. Every "how do I…" question you design away is a conversation your team does not have to answer.
- Retention follows. Products that get people to value quickly keep more of them.
The UX metrics to track
| Metric | What it tells you | Where it comes from |
|---|---|---|
| Task or funnel completion rate | Share of users who finish a flow | Funnels, goals |
| Time to complete | How long a task takes | Events, session data |
| Error rate | Validation errors, JavaScript errors per session | Error tracking |
| Rage clicks and dead clicks | Elements that frustrate or mislead | Heatmaps |
| Scroll depth and exits | Whether content above the fold works | Heatmaps, pages report |
| Core Web Vitals | Loading, responsiveness, visual stability | Real-user monitoring |
| Support contacts per 1,000 sessions | Confusion that users report | Live chat, tickets |
| System Usability Scale (SUS) | Perceived usability (survey, 0–100, average about 68) | Questionnaire |
How to improve user experience: ten techniques
- Answer the visit's question above the fold. Match the headline to the query or ad that brought people in.
- Make speed a design requirement. Keep LCP under 2.5 s, INP under 200 ms and CLS under 0.1 at the 75th percentile.
- Simplify navigation. Use the words visitors use; keep top-level items few and predictable.
- Shorten forms. Remove optional fields, use the right input types, validate inline and explain errors next to the field.
- Give feedback for every action. Loading states, success messages and disabled states that say why.
- Make clickable things look clickable, and non-clickable things not.
- Design for thumbs. Large tap targets, primary actions within reach, no horizontal scrolling.
- Write for scanning. Short paragraphs, descriptive headings, tables for comparisons.
- Build in accessibility. Contrast, keyboard access, labels and focus order help everyone.
- Offer help at the point of doubt. Inline hints, FAQ links, or a chat entry on pricing and checkout pages.
The UX optimization loop
1. Measure a baseline
Pick the flows that matter and record four weeks of completion, time, errors and friction signals by device.
2. Find the biggest friction point
Use funnels to find the step that loses most users, then heatmaps, replays and support conversations to see why.
3. Form a hypothesis
Write it down: "Because users miss the delivery cost until payment, showing it in the cart will reduce payment-step exits."
4. Change one thing
Ship the smallest change that tests the hypothesis, and annotate the release date.
5. Measure again
Compare matching weekdays before and after, or run an A/B test if traffic allows. Keep the change only if the metric moved.
6. Repeat
The next biggest friction point is now the new target.
| Step | Output |
|---|---|
| Baseline | Completion, time and errors per flow and device |
| Friction point | The step that loses most users |
| Hypothesis | Cause and expected effect, in one sentence |
| Change | Smallest change that tests it, annotated |
| Measure | Before/after or A/B result |
Repeat with the next biggest friction point.
Worked example: a sign-up form
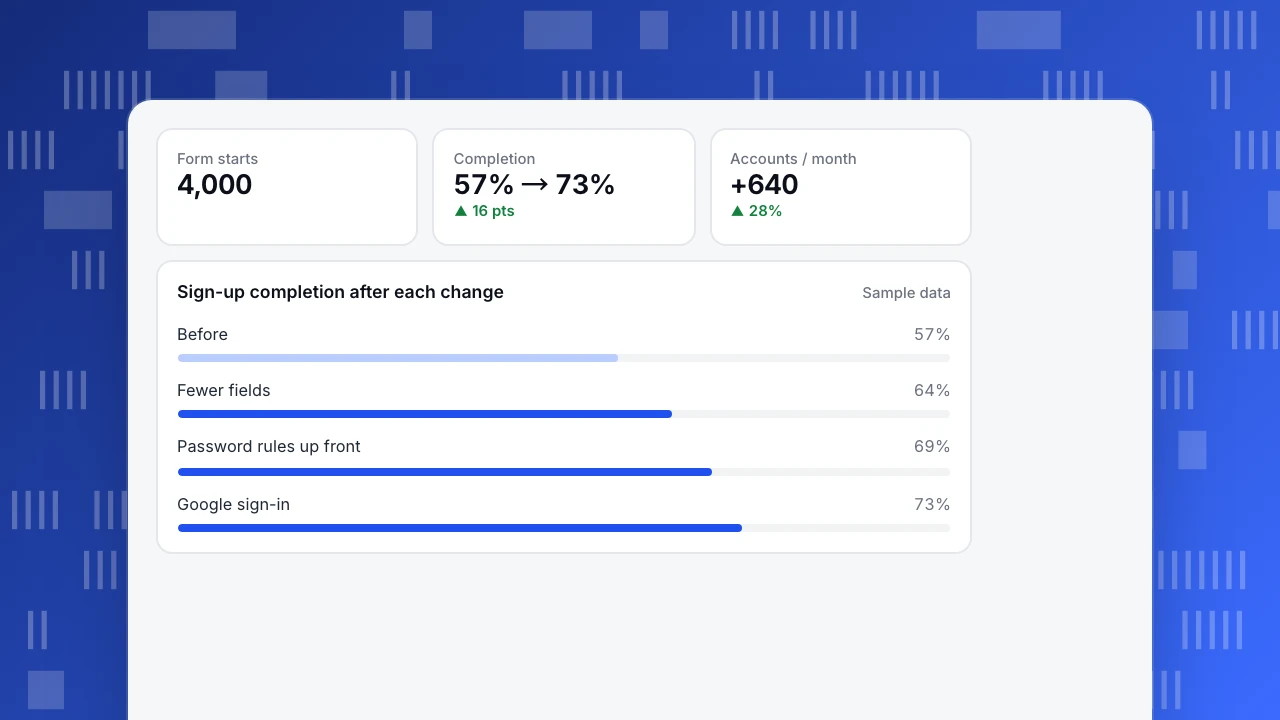
A SaaS sign-up form (sample data) had seven fields. Over four weeks, 4,000 people started it and 2,280 finished: 57%.
| Change | Evidence that led to it | Completion after |
|---|---|---|
| Removed "Company size" and "Phone" (asked later in onboarding) | 31% of abandons happened on these two fields | 64% |
| Showed password rules before typing, not after an error | 1 in 5 sessions had a password validation error | 69% |
| Added "Continue with Google" | Replays showed users switching tabs to find work email | 73% |
Completion went from 57% to 73%: about 640 more accounts a month from the same 4,000 starts. Each change was shipped and measured separately over two weeks.
Form starts
4,000
Completion
57% → 73%
▲ 16 pts
Accounts / month
+640
▲ 28%
Sign-up completion after each change
Sample dataCommon mistakes
- Redesigning instead of fixing. Big redesigns reset learning and often bring new problems.
- Optimizing for clicks instead of completion. More clicks on a button is not success if the task still fails.
- Copying another site's pattern without data. What works for a large retailer may not fit your users.
- Ignoring mobile and slow devices. Test on the hardware and networks your users have.
- Changing too often. Constant changes confuse returning users and make results unreadable.
UX optimization in TapCub
- Find the step: funnels and path analysis show where people drop off and where they go instead.
- See the cause: click and scroll heatmaps, rage clicks, JavaScript errors and session replay (off by default; 10% sample when enabled, inputs masked).
- Measure speed: real-user Core Web Vitals by page and device.
- Hear users: live chat conversations are linked to the visitor's pages.
- Mark changes: add chart annotations on release dates so before/after comparisons are honest.
See also UX metrics, UX analytics and the UX audit guide.
FAQ
What is the difference between UX optimization and CRO? CRO focuses on increasing conversions on specific pages or funnels. UX optimization is broader: it improves any task users try to complete, including ones that are not direct conversions, such as finding help or managing an account.
How do I measure user experience? Combine behavioral metrics (completion, time, errors, rage clicks), speed metrics (Core Web Vitals) and attitudinal metrics (SUS, satisfaction surveys).
Do I need A/B tests for UX optimization? They help on high-traffic flows. On smaller sites, measure before and after on matching days and support the result with replays and support data.
How often should I optimize UX? Continuously, one change at a time, with a monthly review of key flows.
Sources
- Nielsen Norman Group. 10 usability heuristics for user interface design.
- MeasuringU. Measuring usability with the System Usability Scale (SUS).
- web.dev. Web Vitals.
Was this article helpful?
We use your answers to fix and expand this page.
Couldn’t send. Please try again in a minute.
Thanks for the feedback. We’ll use it to improve this page.You’ve already sent feedback on this page. Thanks.

Product Adoption Consultant
Explores customer onboarding, live conversations, and self-service, turning common usage questions into practical guidance and improvements.