Try it on your own data
Every report in this article is in the free plan. One snippet for web and apps, up to 10 sites.
Start freeA web analytics report turns traffic, behavior and conversion data into findings and actions for a specific audience and period. This guide covers report types, what to include, six steps to build one, and a one-page monthly example where growth from paid social hid a drop in organic sign-ups after a migration.
What you will learn
- Start from a business question, not from charts
- Compare whole weeks and like periods
- Report the driver behind every change
- Add context: releases, campaigns, tracking changes
- End with actions and owners
What is a web analytics report?
A web analytics report turns website data (traffic, behavior and conversions over a period) into a short document that answers a business question: is the site doing its job, what changed, why, and what should happen next. A dashboard shows numbers continuously; a report adds selection, comparison and interpretation for a specific audience and date range.
The best web analytics reports are short. They lead with three to five findings, show only the charts that support them, and end with decisions or actions.
Types of web analytics reports
| Report | Audience | Cadence | Focus |
|---|---|---|---|
| Executive summary | Leadership | Monthly / quarterly | Goals vs target, revenue or leads, the two or three biggest changes |
| Marketing channel report | Marketing team | Weekly / monthly | Sessions, conversions and cost by channel and campaign |
| Content report | Content and SEO | Monthly | Top and rising pages, search queries, engagement per article |
| Conversion / funnel report | Product, growth | Weekly | Funnel steps, drop-off, segment differences |
| Technical health report | Developers | Weekly / after releases | Core Web Vitals, errors, 404s, crawl problems |
| Campaign report | Campaign owners | End of campaign | UTM performance, landing pages, conversions, incremental lift |
Most teams need two: a monthly summary for stakeholders and a weekly working report for the people who act on it.
| Section | Answers |
|---|---|
| Headline findings | What changed and why, in 3–5 sentences |
| Goals | Are we on target? |
| Channels and landing pages | Where did the change come from? |
| Friction | What is blocking conversions? |
| Actions | What happens next, and who owns it? |
If a chart does not support a finding, leave it out.
What to include in a web analytics report
- Headline findings. Three to five sentences a reader can stop after.
- Goal performance. Conversions and conversion rate vs target and vs previous period.
- Traffic by channel. Sessions and conversions by source, with the change.
- Landing pages. Top and fastest-changing entry pages with their conversion rate.
- Audience. New vs returning, device, country, only where it explains a change.
- Behavior and friction. Funnel drop-off, exit pages, errors.
- Context. Releases, campaigns, tracking changes, seasonality (annotations).
- Actions. What you recommend, who owns it, and how you will measure it.
How to build a web analytics report in six steps
1. Start from the question
"Did the new pricing page improve trial sign-ups?" produces a better report than "monthly numbers". Write the question at the top.
2. Choose the comparison
Last 28 days vs previous 28; month vs same month last year for seasonal businesses. Compare whole weeks to avoid weekday bias.
3. Check the data
Look for bot spikes, tracking gaps, internal traffic and duplicate conversions before writing anything. Note any change in tracking in the report.
4. Find the drivers
For every metric that moved, break it down by channel, landing page and device to see which part caused the change. Report the driver, not just the total.
5. Write findings, not chart captions
"Organic sign-ups fell 18% because three guides lost rankings after a site migration" is a finding. "Organic traffic chart" is not.
6. Recommend and follow up
End with actions and owners, and open the next report by checking what happened to last month's actions.
Example: a one-page monthly report
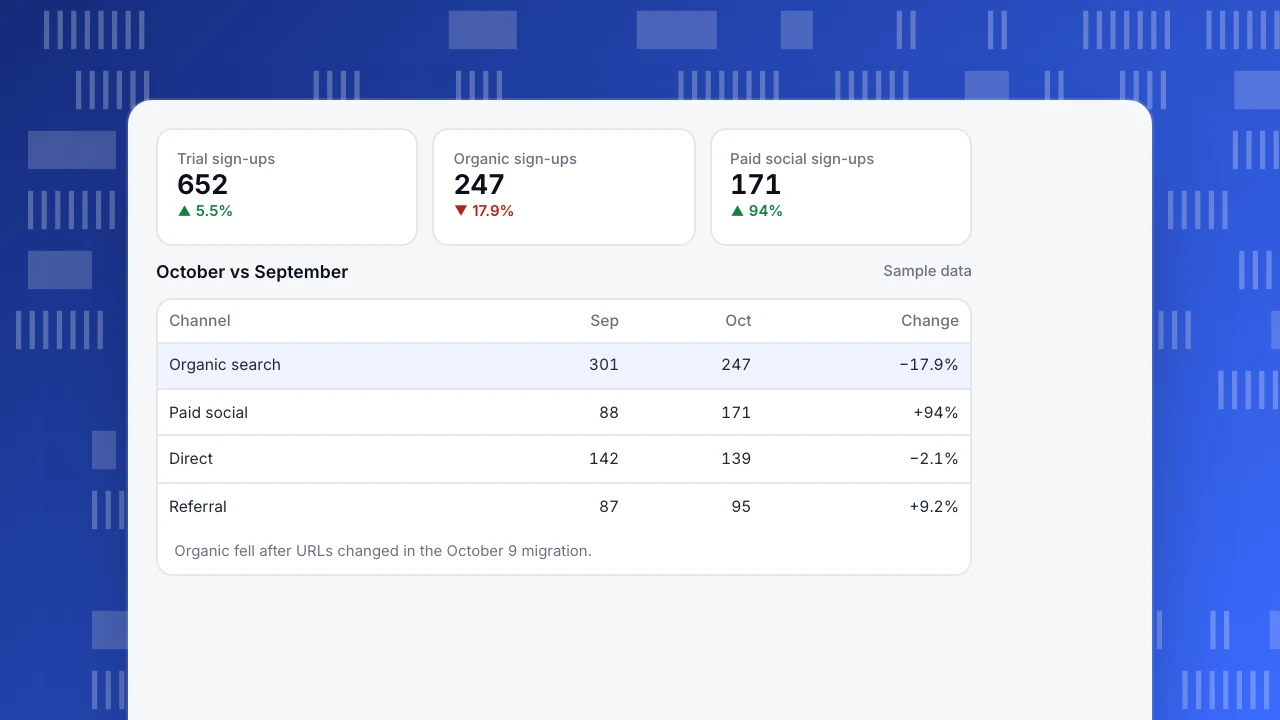
A B2B SaaS site, October vs September (sample data):
| Metric | September | October | Change |
|---|---|---|---|
| Visitors | 41,200 | 44,900 | +9.0% |
| Trial sign-ups | 618 | 652 | +5.5% |
| Sign-up rate | 1.50% | 1.45% | −0.05 pts |
| Organic sign-ups | 301 | 247 | −17.9% |
| Paid social sign-ups | 88 | 171 | +94% |
Findings. (1) Sign-ups grew 5.5%, entirely from a new paid social campaign. (2) Organic sign-ups fell 18%: three integration guides dropped from page one after URLs changed in the site migration on October 9. (3) Paid social visitors convert at 0.9%, below the 1.45% site average, so total sign-up rate dipped. Actions. Add redirects for the old guide URLs (web team, this week); keep the paid social campaign but test a dedicated landing page (marketing); re-check organic sign-ups in the November report.
Trial sign-ups
652
▲ 5.5%
Organic sign-ups
247
▼ 17.9%
Paid social sign-ups
171
▲ 94%
October vs September
Sample data| Channel | Sep | Oct | Change |
|---|---|---|---|
| Organic search | 301 | 247 | −17.9% |
| Paid social | 88 | 171 | +94% |
| Direct | 142 | 139 | −2.1% |
| Referral | 87 | 95 | +9.2% |
Organic fell after URLs changed in the October 9 migration.
Common mistakes
- Reporting everything. Twenty charts with no narrative get skimmed and ignored.
- Totals without drivers. Show which channel, page or device caused a change.
- Vanity metrics first. Page views and time on site matter only if they explain goals.
- No context. A drop without the release or tracking change that caused it leads to the wrong action.
- Inconsistent definitions. Keep metric definitions and date ranges stable from report to report.
Web analytics reporting in TapCub
- Overview, Sources, Pages: compare any range with the previous period or the same period last year; drill from a total into channels, referrers, campaigns and landing pages.
- Goals and funnels: conversion rate and funnel drop-off for the report's main question.
- Why did it change: the AI assistant attributes a metric's change to channels, pages, countries or devices.
- Annotations: mark releases, campaigns and tracking changes on charts. See add chart annotations.
- Delivery: schedule email reports or share a dashboard with stakeholders.
Related: analytics dashboard, marketing KPIs, website analysis.
FAQ
What is the difference between a dashboard and a report? A dashboard updates continuously and lets people explore. A report covers a fixed period, selects what matters and explains it, usually with recommendations.
How often should I send a web analytics report? Weekly for teams who act on the data, monthly for stakeholders, and at the end of each campaign.
What metrics belong in a monthly website report? Goal conversions and rate, traffic and conversions by channel, top landing pages, and the one or two segments that explain the month's changes.
How long should a report be? Short enough to read in five minutes: one page of findings and actions, with charts as supporting evidence.
Sources
- Kaushik, A. Occam's Razor blog: web analytics reporting.
- Google Analytics Help. About reports in Google Analytics.
Was this article helpful?
We use your answers to fix and expand this page.
Couldn’t send. Please try again in a minute.
Thanks for the feedback. We’ll use it to improve this page.You’ve already sent feedback on this page. Thanks.

Product Analyst
Focuses on event analysis, conversion funnels, and retention, using clear metric definitions and structured analysis to explain product performance.