Try it on your own data
Every report in this article is in the free plan. One snippet for web and apps, up to 10 sites.
Start freeWebsite analysis is a structured review of who visits a site, what they do, how fast and reliable it is, and how visible it is in search. This guide gives a seven-step method for your own site, a 28-day worked example where a slow video player explained a drop in sign-ups, and what you can and cannot learn about a competitor from the outside.
What you will learn
- Analyze four areas: traffic, behavior, technical health, search
- Check data quality before drawing conclusions
- Compare like periods and mark tracking changes
- Segment by channel and landing page, not totals
- End with five to ten ranked actions
What is website analysis?
Website analysis is a structured review of how a website performs: who visits it and from where, what they do on it, how fast and reliable it is, and how visible it is in search. The output is not a report full of numbers but a short list of problems and opportunities, ranked by how much they matter to the site's goal.
People use the term for two different jobs. One is analyzing your own site with first-party data from your analytics, server and search console. The other is sizing up someone else's site (a competitor or a prospect) from the outside, using public signals and third-party estimates. This guide covers both, but most of it is about your own site, where the data is exact and you can act on it.
The four areas of a website analysis
| Area | Questions | Data you need |
|---|---|---|
| Traffic | How many people come, from which channels and countries, and is it growing? | Visitors, sessions, sources, landing pages, trend vs last period |
| Behavior | What do they look at, where do they leave, do they reach the goal? | Pages, entry and exit pages, bounce, scroll and clicks, funnels, conversions |
| Technical health | Is the site fast, stable and crawlable? | Core Web Vitals, JavaScript errors, 404s, crawler requests, redirects |
| Search visibility | Which queries show the site, and does it earn the click? | Impressions, clicks, average position, indexed pages |
| Step | Output |
|---|---|
| Goal and period | One goal, comparison window, tracking changes noted |
| Data check | Bots, internal traffic and gaps removed |
| Traffic | Channels and landing pages that changed |
| Behavior | Largest funnel drop-off, problem exit pages |
| Technical health | Slow or broken pages, crawl errors |
| Search | Low-CTR pages, page-two rankings |
| Action list | Ranked fixes with evidence |
The deliverable of a website analysis is the last row.
How to analyze a website, step by step
Step 1: Write down the goal and the period
Decide what the site is for (leads, sales, sign-ups, content reach) and compare like with like: the last 28 days against the previous 28, or this month against the same month last year for seasonal businesses. Mark any tracking changes in the period, such as a new consent banner, because they move numbers without any change in behavior.
Step 2: Check the data before you trust it
Look for bot traffic, internal visits from your own team, duplicate tracking and missing pages. A sudden spike from one country with 100% bounce is usually bots. Compare pageviews with server logs or orders with your backend for one week. Ten minutes here saves you from drawing conclusions from broken data.
Step 3: Analyze traffic
Break visits down by channel (organic search, direct, referral, social, paid, email) and by landing page. Questions to answer:
- Which channels grew or shrank, and is the change in volume or in conversion?
- Which landing pages bring most entrances, and are they the pages you want people to start on?
- Are new and returning visitors behaving differently?
Step 4: Analyze behavior
For the top landing pages, check bounce rate, scroll depth and the next page visitors go to. Then look at the conversion path: build a funnel from landing page to goal and find the step with the largest drop-off. Exit pages are useful: a high exit rate on a confirmation page is fine, on a pricing page it is a problem.
Step 5: Analyze technical health
Review Core Web Vitals from real users at the 75th percentile, JavaScript errors by page, 404 pages that real visitors hit, and how search engine crawlers fetch the site (errors, redirects, blocked pages). Slow or broken pages distort every behavior metric above them.
Step 6: Analyze search visibility
Use Search Console data: which queries show your pages, at which position, and with what click-through rate. Pages with many impressions and few clicks need better titles; pages ranking on page two need more complete content and internal links.
Step 7: Turn findings into a ranked action list
For each finding write the evidence, the likely cause, the fix and the expected impact. Rank by impact × confidence ÷ effort. A good website analysis ends with five to ten actions, not fifty.
Worked example: a 28-day analysis
An online course site (sample data) compares the last 28 days with the previous 28:
| Metric | Previous 28 days | Last 28 days | Change |
|---|---|---|---|
| Visitors | 18,400 | 17,900 | −2.7% |
| Organic search visitors | 9,100 | 7,600 | −16.5% |
| Course sign-ups | 552 | 466 | −15.6% |
| Sign-up rate | 3.0% | 2.6% | −0.4 pts |
| LCP p75, course pages (mobile) | 2.3 s | 3.6 s | slower |
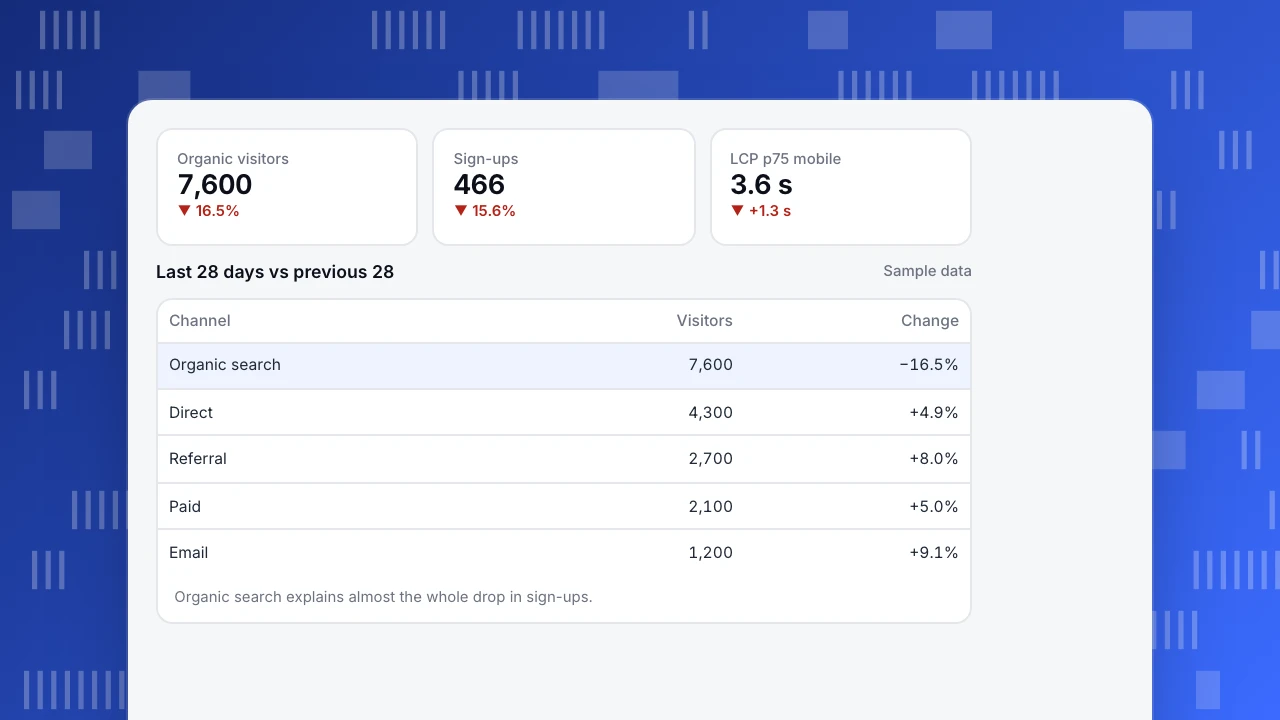
Reading it layer by layer: total visitors barely moved, but organic visitors fell 16.5% and sign-ups fell almost as much. The technical check shows mobile LCP on course pages jumped from 2.3 s to 3.6 s on the date a new video player was added. Search Console shows course pages losing about two positions in the same weeks. The ranked action list starts with one item: lazy-load the video player below the fold. Rewriting copy would have been the wrong first move.
Organic visitors
7,600
▼ 16.5%
Sign-ups
466
▼ 15.6%
LCP p75 mobile
3.6 s
▼ +1.3 s
Last 28 days vs previous 28
Sample data| Channel | Visitors | Change |
|---|---|---|
| Organic search | 7,600 | −16.5% |
| Direct | 4,300 | +4.9% |
| Referral | 2,700 | +8.0% |
| Paid | 2,100 | +5.0% |
| 1,200 | +9.1% |
Organic search explains almost the whole drop in sign-ups.
Analyzing a competitor's website
You cannot see another site's analytics, so outside analysis relies on estimates and public signals:
- Traffic and keywords: SEO tools estimate organic traffic and ranking keywords from search data. Treat them as directional; they can be off by a large margin for smaller sites.
- Content and structure: which page types the site invests in (glossary, guides, tools, comparison pages) and how they link to each other.
- Speed: public field data from the Chrome UX Report through PageSpeed Insights, for sites with enough traffic.
- Technology: scripts and tags visible in the page source.
Use competitor analysis to find gaps and ideas, not to copy numbers into your plan.
Common mistakes
- Reporting totals without segments. A flat total can hide a falling channel and a rising one.
- Skipping the data check. Bots, internal traffic and missing tags make many "insights" fake.
- Analyzing every page. Focus on the landing pages and funnels that carry most of the value.
- Confusing correlation with cause. Two lines moving together in the same week need a mechanism before you act.
- Ending with a dashboard instead of actions. The deliverable is a ranked list of fixes.
How to analyze a website in TapCub
- Traffic: Web analytics › Overview and Sources compare any period with the previous one; landing pages are in Pages › Entry pages.
- Behavior: Pages shows visited, entry and exit pages with bounce and time on page; open a page's click map from its row. Build a funnel from landing page to goal.
- Technical health: Monitoring › Performance shows real-user Core Web Vitals by page; Monitoring › Crawl health shows how search and AI crawlers fetch your site, including errors and 404s. See check crawl health.
- Data quality: bots are filtered and shown separately, and you can exclude internal traffic.
- Search: connect Search Console to see queries, impressions and positions next to traffic.
For a full checklist see the web analytics audit.
FAQ
How often should I analyze my website? A short check of traffic, conversions and errors every week, and a full analysis of all four areas every month or after a major release.
What is the difference between website analysis and a website audit? An audit checks a site against a fixed checklist (technical SEO, accessibility, tracking setup). An analysis looks at performance data to find what is changing and why. In practice a good analysis includes a quick audit of data quality.
Can I analyze a website without access to its analytics? Partly. You can estimate traffic and keywords with SEO tools, test speed with PageSpeed Insights and review content and structure, but behavior and conversion data are only available to the site owner.
Which metrics matter most? The ones tied to the site's goal: conversion rate and conversions by channel and landing page, followed by the metrics that explain them, such as bounce, drop-off and page speed.
Sources
- Google Search Central. Search Console performance report.
- web.dev. Web Vitals.
- Chrome for Developers. Chrome UX Report overview.
Was this article helpful?
We use your answers to fix and expand this page.
Couldn’t send. Please try again in a minute.
Thanks for the feedback. We’ll use it to improve this page.You’ve already sent feedback on this page. Thanks.

Customer Experience Consultant
Writes about live chat, visitor conversations, and self-service, sharing practical ways to make customer communication clearer and more effective.