Try it on your own data
Every report in this article is in the free plan. One snippet for web and apps, up to 10 sites.
Start freeA speed test tells you how one page did once. Monitoring tells you how every page does for real visitors every day, and when that changes. This guide compares real user and synthetic monitoring, sets out the metrics and thresholds, and walks through a release regression that only showed up on mobile.
What you will learn
- Use real user monitoring for what users get, synthetic for uptime
- Judge Core Web Vitals at the 75th percentile
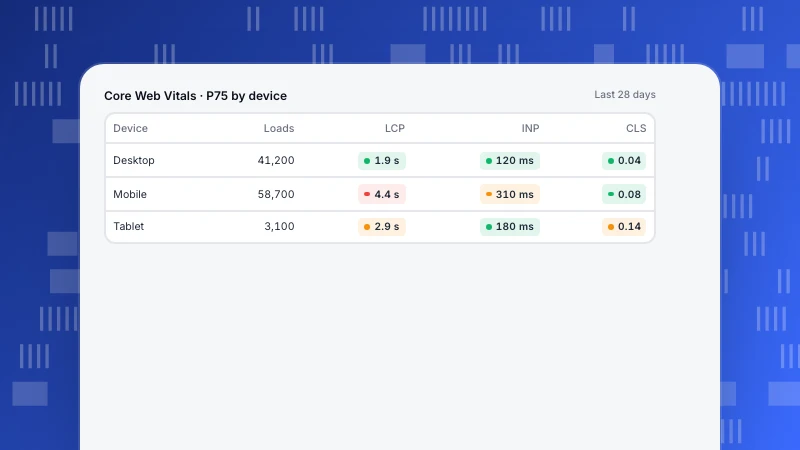
- Split by device: mobile regressions can hide behind good desktop numbers
- Alert on per-template changes after releases
- Tie speed to conversion to get fixes prioritized
What is web performance monitoring?
Web performance monitoring is the continuous measurement of how fast and stable a website is for its visitors: how long pages take to load and render, how quickly they respond to input, whether the layout jumps, and whether errors break the experience. The goal is to notice regressions before users and revenue do, and to know which pages, devices and regions to fix first.
It differs from a one-off speed test. A Lighthouse or PageSpeed run tells you how one page performed once, on one simulated device. Monitoring tells you how every page performs for real visitors, every day, and alerts you when that changes.
The two main approaches: RUM and synthetic monitoring
| Real user monitoring (RUM) | Synthetic monitoring | |
|---|---|---|
| How it works | A script in visitors' browsers reports timings from real page loads | Scripted browsers load pages on a schedule from fixed locations |
| Shows | What users actually experience, across devices, networks and countries | Consistent lab measurements and availability |
| Strengths | Real distribution (P75, P95), segments, ties to conversion | Works with no traffic, catches outages, stable baseline for comparisons |
| Weaknesses | Needs traffic; noisy on low-traffic pages; no data if the script is blocked | Not real users; misses device and network variety |
| Best for | Prioritizing fixes and proving impact | Uptime checks, pre-release testing, competitor benchmarks |
Most teams need both: synthetic checks to catch outages and test releases, RUM to see what users get. Server-side monitoring (APM) covers the back end, such as slow database queries behind a slow time to first byte.
| RUM | Synthetic | |
|---|---|---|
| Data from | Real visitors | Scripted browsers |
| Best for | Prioritizing fixes | Uptime and pre-release tests |
| Weak spot | Needs traffic | Not real users |
Most teams use both, plus APM for the back end.
Which metrics to monitor
Google's Core Web Vitals are the standard set for real-user experience, assessed at the 75th percentile of page loads:
| Metric | Measures | Good | Poor |
|---|---|---|---|
| Largest Contentful Paint (LCP) | Loading: when the main content appears | ≤ 2.5 s | > 4 s |
| Interaction to Next Paint (INP) | Responsiveness to clicks, taps and keys | ≤ 200 ms | > 500 ms |
| Cumulative Layout Shift (CLS) | Visual stability | ≤ 0.1 | > 0.25 |
| First Contentful Paint (FCP) | When anything first renders | ≤ 1.8 s | > 3 s |
| Time to First Byte (TTFB) | Server and network response | ≤ 0.8 s | > 1.8 s |
Add JavaScript error rate, availability (uptime) and, for applications, API latency for a complete picture.
Worked example: catching a release regression
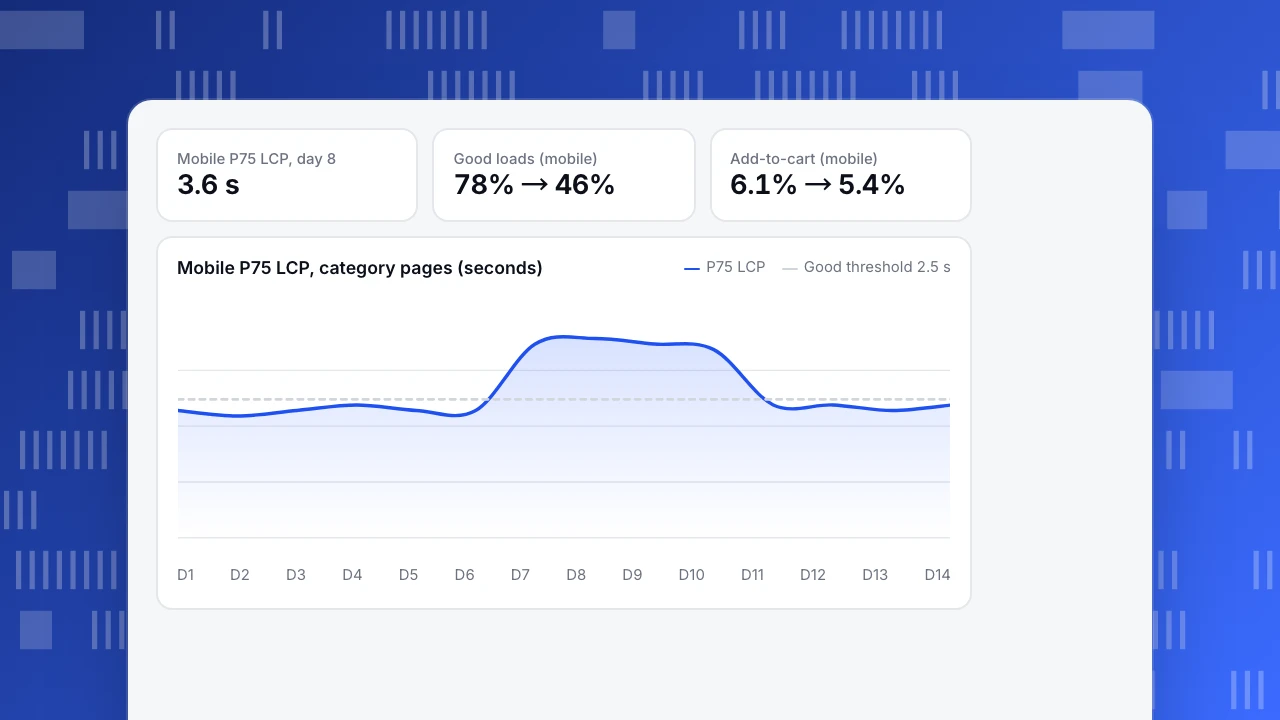
An ecommerce site monitored P75 LCP daily, split by device. A release on day 7 added a large, uncompressed hero image carousel to category pages (sample figures):
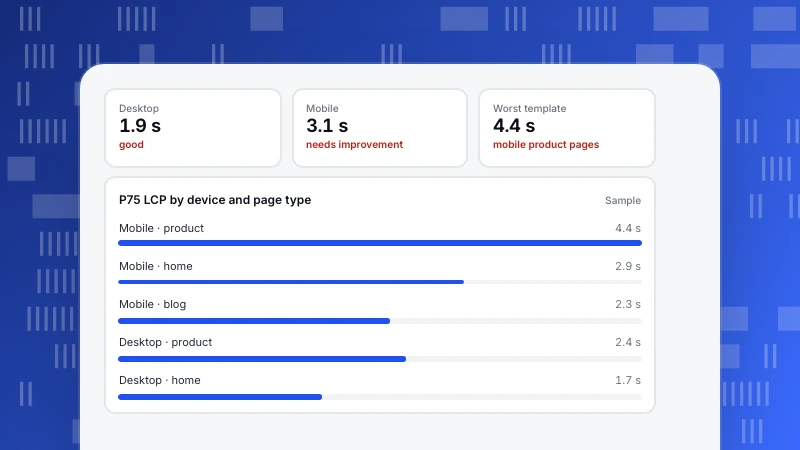
- Mobile P75 LCP on category pages went from 2.3 s to 3.5 s overnight. Desktop moved from 1.6 s to 1.9 s, still "good," so a desktop-only check would have missed it.
- Share of mobile loads rated good fell from 78% to 46%.
- Mobile add-to-cart rate from category pages fell from 6.1% to 5.4% over the three days the regression was live.
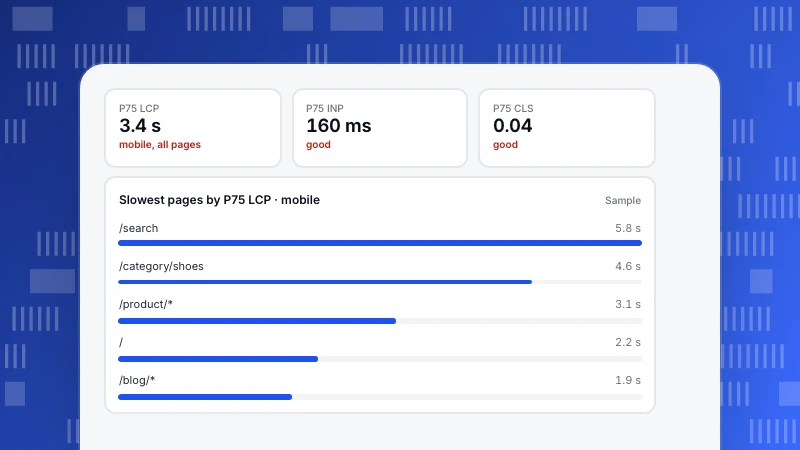
- The slowest pages list put three category templates at the top, all sharing the new carousel component, which made the cause obvious within an hour of looking.
The team replaced the carousel's first slide with a properly sized, preloaded image and lazy-loaded the rest. On day 11 mobile P75 LCP was back to 2.4 s and add-to-cart recovered to 6.0%. Without device-level RUM the regression would have shown up only as an unexplained dip in revenue.
Mobile P75 LCP, day 8
3.6 s
Good loads (mobile)
78% → 46%
Add-to-cart (mobile)
6.1% → 5.4%
Mobile P75 LCP, category pages (seconds)
P75 LCPGood threshold 2.5 sHow to set up web performance monitoring
- Install RUM on every page and confirm it collects Core Web Vitals.
- Set targets at P75 using the good thresholds, per page template, not only site-wide.
- Segment by device, country and browser. Mobile on slower networks is usually where problems are.
- Add synthetic checks for key pages and uptime, run from the regions your users are in.
- Alert on changes, for example P75 LCP above 2.5 s for a template two days in a row, or error rate doubling after a release.
- Tie performance to outcomes. Compare conversion, bounce and engagement by speed bucket.
- Review after each release and keep a performance budget (image weight, JavaScript size) in CI.
Common mistakes
- Watching averages. A mean hides the slow tail that real users feel; use percentiles.
- Testing only on a fast laptop. Lab results on developer hardware look far better than mobile reality.
- One site-wide score. Problems are usually specific to a template, a device or a region.
- Ignoring low-traffic pages' noise. Percentiles jump when there are few samples; wait for enough data before reacting.
- No link to business metrics. Without conversion by speed, performance work struggles to get priority.
Monitoring web performance in TapCub
Monitoring › Performance shows LCP, CLS, INP, FCP and TTFB from real visitors' browsers, switchable between P95, P75, median and average, with breakdowns by page, country, device, browser and operating system. Each load is split into backend, network and front-end render time, and a Slowest pages list is sorted by P75 LCP. Monitoring › Errors groups JavaScript errors with rate, affected visitors and sessions, plus rage clicks and error clicks per page. Set up traffic alerts for sudden changes (Set up traffic alerts), and see Check Core Web Vitals and Find JavaScript errors. Related: Real user monitoring and Website performance metrics.
See also: First input delay (FID), DOMContentLoaded, Speed Index, Page experience.
See also: Improve app performance.
Sources
- web.dev, Web Vitals.
- web.dev, How the Core Web Vitals metrics thresholds were defined.
Was this article helpful?
We use your answers to fix and expand this page.
Couldn’t send. Please try again in a minute.
Thanks for the feedback. We’ll use it to improve this page.You’ve already sent feedback on this page. Thanks.

Technical Engineer
Focuses on tracking code, SDKs, and API integrations, with practical guidance on implementation checks and troubleshooting.