Try it on your own data
Every report in this article is in the free plan. One snippet for web and apps, up to 10 sites.
Start freeA good page load time is one where the main content of the page is visible within 2.5 seconds for at least three in four real visits. That is a specific target: it uses Largest Contentful Paint rather than "fully loaded", and the 75th percentile rather than an average. This guide explains why, lists targets for the related timings and shows how to check your own pages.
What you will learn
- Target LCP of 2.5 seconds or less at the 75th percentile of real visits
- "Fully loaded" time includes things visitors do not wait for; it is a poor target
- Check mobile separately and look at the slowest page templates first
The short answer
Aim for Largest Contentful Paint of 2.5 seconds or less at the 75th percentile of real visits. In plain words: for at least three in four visits, the main content should be visible within 2.5 seconds.
Why not "fully loaded" time?
"Load time" in many tools means when every resource on the page has finished: images below the fold, chat widgets, analytics scripts. Visitors do not wait for those. A page can feel ready in 1.5 seconds and still report a 7-second full load.
LCP measures when the largest piece of content in view, usually the main image or heading, has appeared. It matches what people experience much more closely.
Why the 75th percentile?
An average mixes fast and slow visits into one number that describes nobody. The 75th percentile says: three in four visits were this fast or faster. It keeps the slow quarter in view without letting a few extreme visits dominate.
Targets for each timing
The table gives the thresholds for the four timings that matter most. LCP is the headline target; FCP and TTFB explain why LCP is slow; INP covers how quickly the page responds once loaded.
| Timing | Good | Needs improvement | Poor |
|---|---|---|---|
| Largest Contentful Paint (main content) | ≤ 2.5 s | 2.5–4 s | > 4 s |
| First Contentful Paint (first content) | ≤ 1.8 s | 1.8–3 s | > 3 s |
| Time to First Byte (server response) | ≤ 0.8 s | 0.8–1.8 s | > 1.8 s |
| Interaction to Next Paint (response to input) | ≤ 200 ms | 200–500 ms | > 500 ms |
Judge each at the 75th percentile of real visits.
A worked example
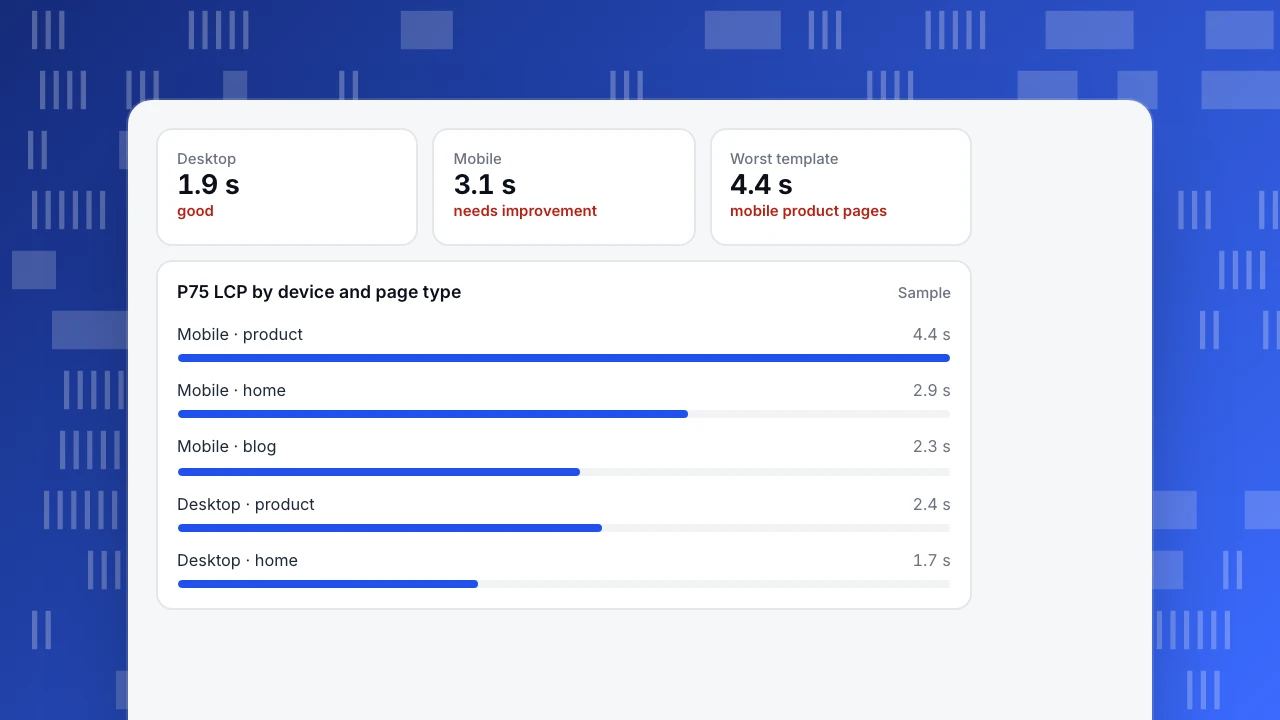
A shop checks its real-user data. Desktop passes easily at 1.9 seconds. Mobile is 3.1 seconds, in the "needs improvement" band. Splitting by page template shows mobile product pages at 4.4 seconds, the worst by far: a large uncompressed product image and two blocking scripts. Compressing the image and deferring the scripts brings mobile product pages to 2.4 seconds.
Desktop
1.9 s
good
Mobile
3.1 s
needs improvement
Worst template
4.4 s
mobile product pages
P75 LCP by device and page type
SampleHow to check your own pages
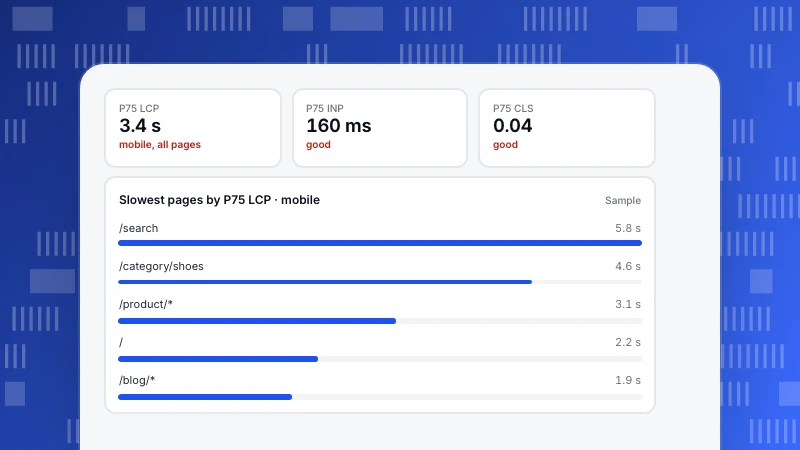
- Collect real-user timings on every page. In TapCub, page vitals are sent once when the page is hidden, and the Performance report shows P75 by default for the slowest-pages list.
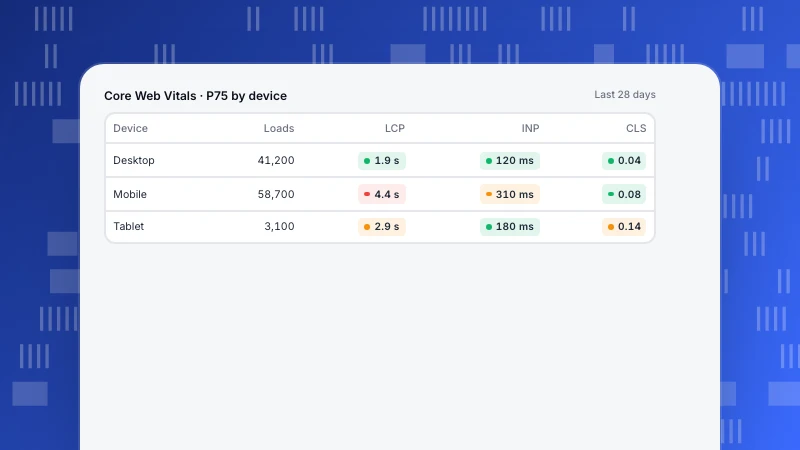
- Look at mobile and desktop separately.
- Sort page templates by P75 LCP and start with the slowest that also get traffic.
- Use the load timing split (backend, network, frontend) to find where time goes. More in website performance metrics.
Does load time affect bounce rate and SEO?
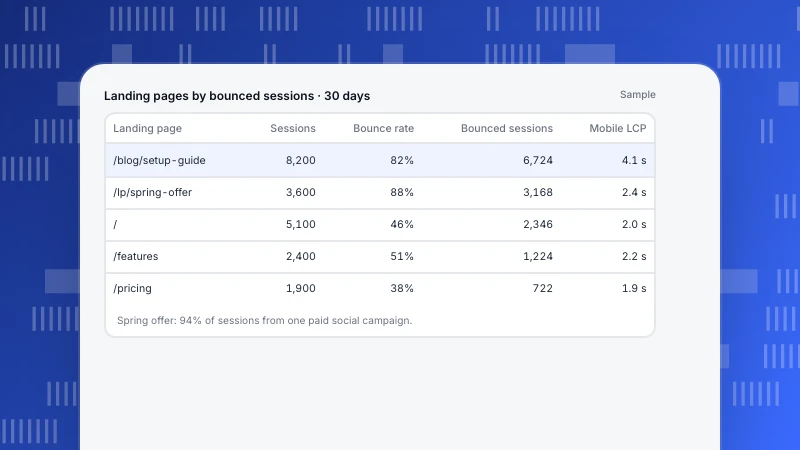
Slow pages lose visitors before they see anything, which shows up as fewer pageviews and lower conversion. Core Web Vitals, including LCP, are also used by Google as a page experience signal. Speed alone will not rank a page, but a slow page loses visitors whatever its position. See how to reduce bounce rate.
FAQ
What is a good page load time in seconds?
2.5 seconds or less for Largest Contentful Paint at the 75th percentile of real visits.
Is 3 seconds a good load time?
For LCP, 3 seconds is in the "needs improvement" band. It is not poor, but it is worth working on, especially on mobile.
Why is my lab test fast but real users slow?
Lab tests run on one fast device and network. Real visitors use slower phones and networks, and are farther from your server.
See also: DOMContentLoaded, Speed Index.
See also: Website optimization, Mobile CRO.
Was this article helpful?
We use your answers to fix and expand this page.
Couldn’t send. Please try again in a minute.
Thanks for the feedback. We’ll use it to improve this page.You’ve already sent feedback on this page. Thanks.

Technical Engineer
Focuses on tracking code, SDKs, and API integrations, with practical guidance on implementation checks and troubleshooting.