Try it on your own data
Every report in this article is in the free plan. One snippet for web and apps, up to 10 sites.
Start freeMobile CRO raises the share of phone and tablet visitors who complete a goal. Mobile is usually most of the traffic and less of the conversions, for reasons specific to small screens, touch input, networks and payments. This guide covers the causes, a checklist with measurable thresholds, a five-step process and a store where fixing an app-switch bug lifted mobile checkout from 41% to 52%.
What you will learn
- Split every funnel by device
- Find steps where mobile lags while earlier steps match
- Use real-user mobile speed and browser-level errors
- Offer wallets and keep form state across app switches
- Count cross-device conversions where users sign in
What is mobile CRO?
Mobile CRO (mobile conversion rate optimization) is the practice of increasing the share of visitors on phones and tablets who complete a goal, whether on a mobile website or in an app. It deserves its own attention because mobile visitors usually make up the majority of traffic yet convert at a lower rate than desktop visitors, and the reasons are specific to small screens, touch input, slower networks and interrupted attention.
The gap between mobile and desktop conversion is the opportunity. Closing even part of it is often worth more than any desktop improvement.
Why mobile visitors convert less
| Cause | What it looks like | Typical fix |
|---|---|---|
| Slow loading on mobile networks | High bounce before the page renders | Smaller images, fewer scripts, preload the hero |
| Small tap targets and crowded layouts | Mis-taps, rage clicks near buttons | Larger targets, more spacing, one column |
| Typing on a phone | Abandonment on long forms | Fewer fields, correct keyboard types, autofill |
| Payment friction | Drop-off at card entry or one-time codes | Wallets (Apple Pay, Google Pay), saved cards, keep state when switching apps |
| Interrupted sessions | Return later on desktop | Saved carts, email links, cross-device continuity |
| Intrusive pop-ups | Bounce immediately after an overlay | Inline offers instead of full-screen interstitials |
| Hidden information | Scrolling up and down repeatedly | Key info (price, delivery, CTA) visible without hunting |
| Check | Target |
|---|---|
| LCP p75 mobile | ≤ 2.5 s |
| INP p75 mobile | ≤ 200 ms |
| Tap target size | ≥ 24×24 CSS px |
| Body text | ≈ 16 px, no zoom needed |
| Entry interstitials | None covering content |
Thresholds from web.dev and WCAG 2.2.
Mobile CRO checklist
- LCP under 2.5 s and INP under 200 ms at the 75th percentile on mobile.
- Tap targets at least 24×24 CSS pixels with spacing, primary actions within thumb reach.
- No horizontal scrolling; text readable without zooming (16 px body text is a common baseline).
- Forms use the right input types (email, tel, number) and autocomplete attributes.
- Wallet payments offered where customers use them.
- Sticky or repeated call to action on long pages.
- No full-screen interstitial covering content on entry.
- State preserved when users switch apps (verification codes, banking apps).
How to run mobile CRO
1. Split every report by device
Compare mobile and desktop conversion for each step of each funnel. Look for steps where mobile is far below desktop while earlier steps are similar.
2. Check speed and errors on real devices
Use real-user Core Web Vitals for mobile, and JavaScript errors by browser (Safari on iOS behaves differently from Chrome on Android).
3. Watch mobile sessions
Heatmaps and replays from phones reveal mis-taps, zooming, scroll hunting and forms that reset.
4. Fix, then test
Ship fixes for bugs and obvious friction directly. Test layout and copy changes on mobile traffic specifically.
5. Measure cross-device conversion
Some mobile visitors convert later on desktop. Where users sign in, look at people-based conversion across devices so mobile is not undervalued.
Worked example: a mobile checkout
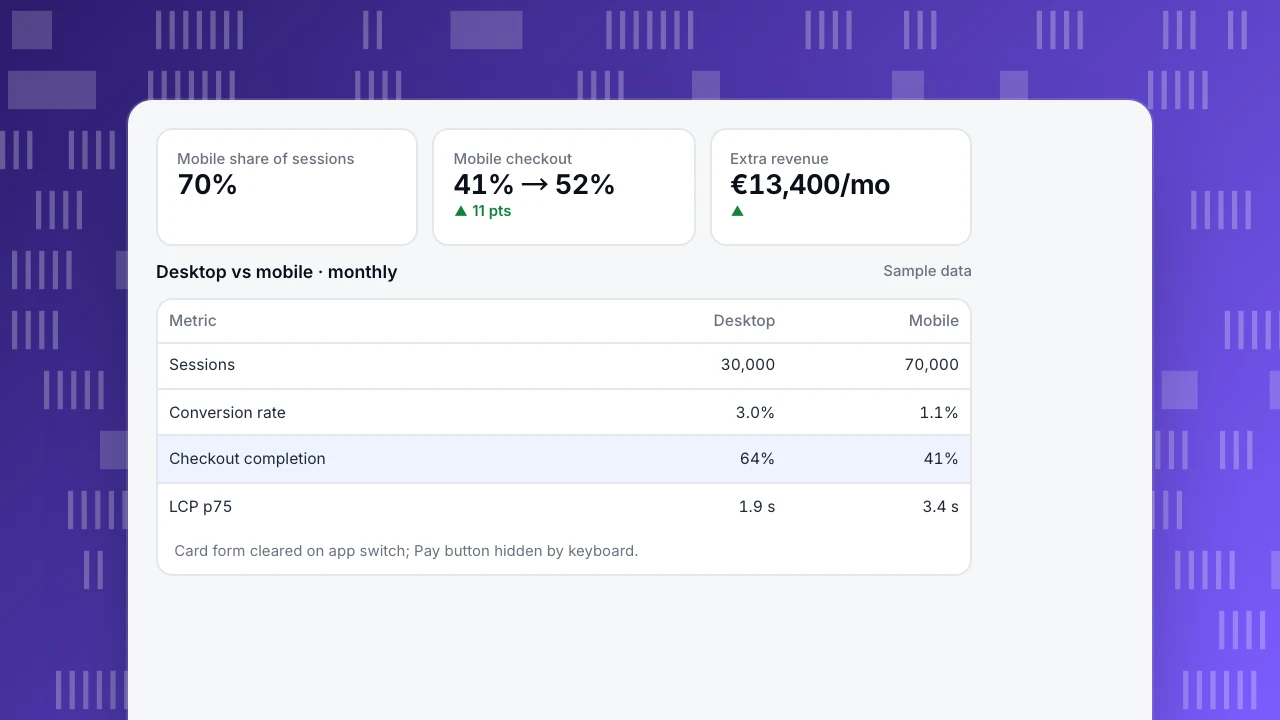
A store (sample data) gets 70% of sessions from phones but only 45% of orders. Average order value €64.
| Metric | Desktop | Mobile |
|---|---|---|
| Sessions / month | 30,000 | 70,000 |
| Conversion rate | 3.0% | 1.1% |
| Checkout completion | 64% | 41% |
| LCP p75 | 1.9 s | 3.4 s |
Mobile replays showed two problems: the card form cleared when users switched to their banking app for a one-time code, and the "Pay" button sat below the keyboard. After preserving form state, moving the button above the keyboard area and adding wallet payments, mobile checkout completion rose to 52% and mobile conversion to 1.4%: about 210 more orders and €13,400 more revenue a month.
Mobile share of sessions
70%
Mobile checkout
41% → 52%
▲ 11 pts
Extra revenue
€13,400/mo
▲
Desktop vs mobile · monthly
Sample data| Metric | Desktop | Mobile |
|---|---|---|
| Sessions | 30,000 | 70,000 |
| Conversion rate | 3.0% | 1.1% |
| Checkout completion | 64% | 41% |
| LCP p75 | 1.9 s | 3.4 s |
Card form cleared on app switch; Pay button hidden by keyboard.
Common mistakes
- Designing on desktop and shrinking. Start from the phone layout.
- Looking at blended conversion rates. Always split by device.
- Testing on new phones over Wi-Fi. Use mid-range devices and throttled networks.
- Treating mobile visits as low-value. Many become desktop or app conversions later.
- Adding more pop-ups to "capture" mobile visitors. They usually raise bounce.
Mobile CRO with TapCub
- Device split everywhere: filter or break down funnels, pages, goals and sources by device type, browser and OS.
- Speed: real-user Core Web Vitals by device; see check Core Web Vitals.
- Errors: JavaScript errors by page and browser; see find JavaScript errors.
- Behavior: heatmaps per device, rage clicks and session replay (off by default).
- Cross-device: when users sign in, identify users so conversions are counted per person across devices.
- Apps: for native apps, see mobile app conversion rate.
Related: Web Vitals, ecommerce CRO, good page load time.
FAQ
Why is mobile conversion lower than desktop? Smaller screens, typing on touch keyboards, slower networks, payment friction and interrupted sessions. Some mobile visitors also research on the phone and buy later on desktop.
What is a good mobile conversion rate? It depends on the category. Compare your mobile and desktop rates for the same funnel steps; a large gap at one step is the clearest opportunity.
Does page speed matter more on mobile? Yes. Mobile devices and networks are slower, so the same page usually loads and responds more slowly, and visitors are less patient.
Should I build a separate mobile site? Usually not. A responsive site with a mobile-first layout is easier to maintain and is what Google recommends.
Sources
- Google Search Central. Mobile-first indexing best practices.
- web.dev. Sign-up form best practices.
- W3C. WCAG 2.2: target size (minimum).
Was this article helpful?
We use your answers to fix and expand this page.
Couldn’t send. Please try again in a minute.
Thanks for the feedback. We’ll use it to improve this page.You’ve already sent feedback on this page. Thanks.

Growth Strategist
Explores acquisition channels, activation, and conversion experiments, turning data insights into actionable growth hypotheses and evaluation methods.