Try it on your own data
Every report in this article is in the free plan. One snippet for web and apps, up to 10 sites.
Start freeMobile app optimization improves an app so more people install it, get through the first session, return and pay. This guide covers the four areas (stability, onboarding and engagement, conversion, store visibility), why stability comes first, and a release comparison where three changes lifted next-day retention by five points.
What you will learn
- Fix crashes and slow starts before store optimization
- Shorten the path from first open to first value
- Compare every metric by app version
- Analyze iOS and Android funnels separately
- Test on mid-range devices, not only flagships
What is mobile app optimization?
Mobile app optimization is the work of improving an app so that more people install it, get through the first session, come back and pay. It spans four areas: stability and performance (the app opens fast and does not crash), onboarding and engagement (new users reach value quickly and form a habit), conversion (purchases, subscriptions or sign-ups work smoothly) and store visibility (people find and choose the app in the App Store and Google Play).
The term is sometimes used for app store optimization (ASO) alone. ASO matters, but it only brings people to the door. If the app crashes on launch or the first screen is confusing, every extra install leaks out. This guide treats optimization as one loop across all four areas and shows how to decide which one to work on first.
Why app optimization pays off
- Most users decide early. Day-1 retention for many app categories sits in the 20–30% range: most new users never come back after the first day. Small gains in the first session compound across every later cohort.
- Crashes and slow starts drive uninstalls and bad reviews. Google Play's Android vitals treat a user-perceived crash rate above 1.09% and an ANR rate above 0.47% as "bad behavior" thresholds that can reduce an app's visibility.
- Store conversion multiplies paid acquisition. If 30% of store page visitors install instead of 25%, every ad dollar buys 20% more installs.
The four areas and their metrics
| Area | Key metrics | Where problems show |
|---|---|---|
| Stability and performance | Crash-free users, ANR rate, cold start time, memory, frame rate | Specific versions, OS versions, device models |
| Onboarding and engagement | Next-day retention, engaged sessions, screens per session, DAU/MAU | First-session funnel, drop-off screens |
| Conversion | Purchase or subscription conversion, paywall view → purchase, cart abandonment | Paywall, checkout, sign-in |
| Store visibility | Store page conversion (views → installs), rating, keyword ranks | Store listing, screenshots, reviews |
| Signal | Threshold or target | Source |
|---|---|---|
| User-perceived crash rate | Bad behavior above 1.09% | Android vitals |
| User-perceived ANR rate | Bad behavior above 0.47% | Android vitals |
| Crash-free users | Many teams target 99.5%+ | Industry practice |
| Cold start | Android flags 5 s or more as excessive | Android vitals |
Check the current thresholds in the Play Console; Google updates them.
How to optimize a mobile app
1. Instrument before you optimize
You need screens, starts, sessions, key events (sign-up, first core action, purchase) and crash reporting from every platform you ship. Check that each SDK actually reports crashes automatically; some frameworks need manual error reporting.
2. Fix stability first
A crash on a payment screen beats any copy test for impact. Sort error groups by affected users, check whether they cluster in one app version or one OS version, and fix the top three. Track crash-free users per version so you can see when a release regresses.
3. Shorten time to value
List the steps between first open and the moment the user gets value (finishing a lesson, seeing their first report, completing a first order). Remove or defer every step that is not required: optional permissions, profile fields, tutorials. Measure the first-session funnel and next-day retention by acquisition cohort.
4. Build a reason to return
Look at how often retained users open the app and what they do in their first week. Use that to design reminders, saved progress and content that matches the real usage interval. A weekly-use app should not send daily notifications.
5. Remove friction in conversion
Analyze the paywall and checkout as funnels: view → start → complete. Check where the steps differ by platform; payment sheets and sign-in flows often behave differently on iOS and Android.
6. Improve the store page
Use your store console's experiments to test icons, screenshots and the first lines of the description. Reply to reviews that mention bugs once they are fixed. Ratings follow stability: fix crashes before you ask for reviews.
7. Ship, compare versions, repeat
Compare every metric above by app version. Releases are your natural experiment: a version that raises crash-free users and next-day retention is the one to keep building on.
Worked example: one release, three changes
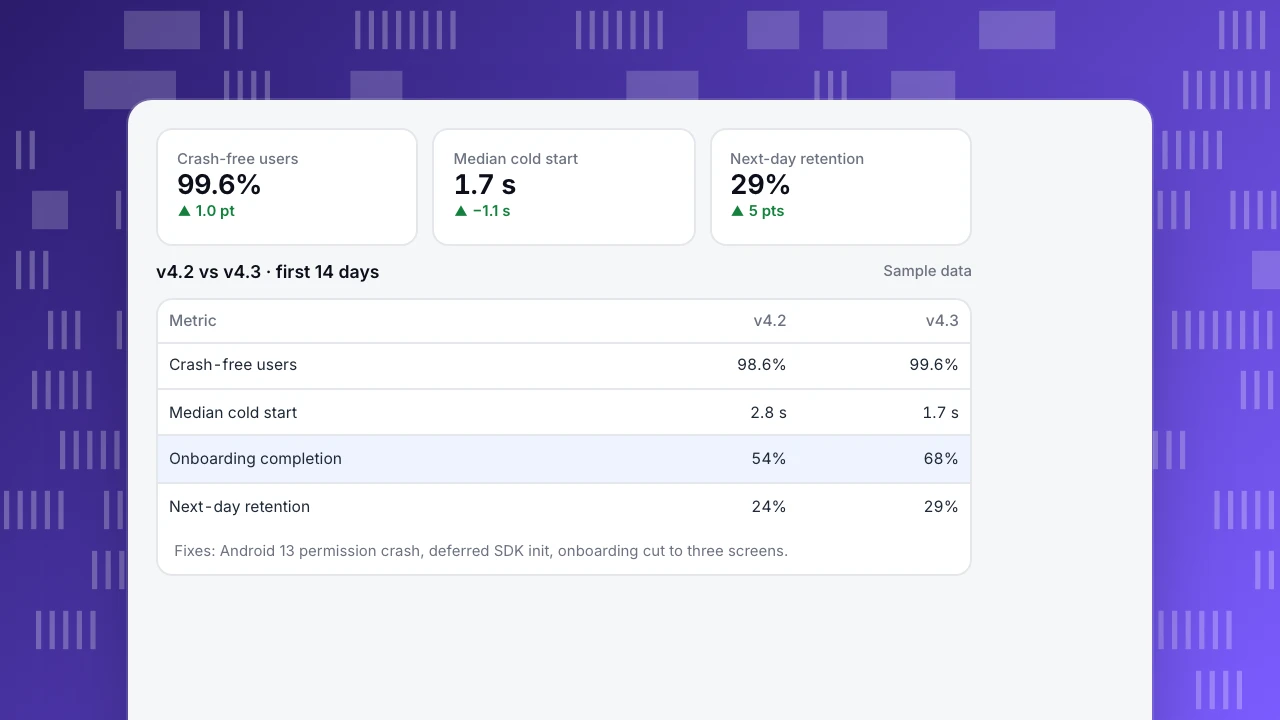
A habit-tracking app (sample data) compares version 4.2 with version 4.3 over the first 14 days after each release:
| Metric | v4.2 | v4.3 | Change |
|---|---|---|---|
| Crash-free users | 98.6% | 99.6% | +1.0 pt |
| Median cold start | 2.8 s | 1.7 s | −1.1 s |
| Onboarding completion | 54% | 68% | +14 pts |
| Next-day retention (new users) | 24% | 29% | +5 pts |
What changed in 4.3: a crash on Android 13 when the camera permission was denied was fixed; three SDKs that initialized on launch were deferred until first use; and the onboarding was cut from five screens to three by moving goal-setting to after the first check-in. With 10,000 new users a week, five extra points of next-day retention mean about 500 more people coming back on day two, every week.
Crash-free users
99.6%
▲ 1.0 pt
Median cold start
1.7 s
▲ −1.1 s
Next-day retention
29%
▲ 5 pts
v4.2 vs v4.3 · first 14 days
Sample data| Metric | v4.2 | v4.3 |
|---|---|---|
| Crash-free users | 98.6% | 99.6% |
| Median cold start | 2.8 s | 1.7 s |
| Onboarding completion | 54% | 68% |
| Next-day retention | 24% | 29% |
Fixes: Android 13 permission crash, deferred SDK init, onboarding cut to three screens.
Common mistakes
- Starting with ASO while the app crashes. More installs into a broken first session raises acquisition cost.
- Looking at averages across all versions. A bad release hides inside a blended crash rate. Always split by version.
- Optimizing for opens instead of value. Notifications that drive opens but not the core action inflate DAU and annoy users.
- Testing on flagship phones only. Cold start and memory problems show up on mid-range and older devices.
- Treating iOS and Android as one funnel. Permissions, payments and navigation differ; analyze each platform separately.
Mobile app optimization in TapCub
- Stability: App analytics › Quality & attribution › Stability shows crash-free users (1 − crash users ÷ active users), crashes, ANRs, UI freezes, median cold and hot start and memory, with error groups you can mark resolved.
- Versions: Versions & channels compares active users, new users and crashes per app version, so you can see a release's effect. See track app versions.
- Retention and engagement: the Users & retention report shows next-day retention, engaged sessions and five distributions (duration, frequency, interval, screens, starts). See app engagement metrics and app retention rate.
- Funnels: build onboarding, paywall and checkout funnels from screen views and events.
TapCub does not run store listing experiments or in-app A/B tests; use the App Store and Google Play consoles for store tests.
FAQ
Is mobile app optimization the same as app store optimization? No. ASO improves how an app ranks and converts in app stores. Mobile app optimization also covers stability, onboarding, engagement and in-app conversion.
What is a good crash-free users rate? Many teams aim for 99.5% crash-free users or higher. Google Play flags apps above a 1.09% user-perceived crash rate as having bad behavior.
Which metric should I watch after a release? Crash-free users and cold start time per version in the first days, then next-day retention for new users acquired after the release.
How do I optimize an app with a small user base? Fix crashes and obvious onboarding friction first; these do not need statistical tests. Compare versions over longer windows and read session-level data to understand why people drop off.
Sources
- Android Developers. Android vitals: core vitals and bad behavior thresholds.
- Apple Developer. Product page optimization.
- Android Developers. App startup time.
Was this article helpful?
We use your answers to fix and expand this page.
Couldn’t send. Please try again in a minute.
Thanks for the feedback. We’ll use it to improve this page.You’ve already sent feedback on this page. Thanks.

Technical Engineer
Focuses on tracking code, SDKs, and API integrations, with practical guidance on implementation checks and troubleshooting.