Try it on your own data
Every report in this article is in the free plan. One snippet for web and apps, up to 10 sites.
Start freeA spike in daily actives can mean more people found value, or that a push notification got more people to tap and leave. This guide lists the app engagement metrics with formulas, explains how to judge them by app type, and walks through a notification change where the headline numbers and the real engagement disagreed.
What you will learn
- Track stickiness (DAU/MAU), session interval and engaged sessions
- Judge engagement against the natural frequency of your app type
- Starts can be inflated by notifications; engaged sessions cannot
- Crash-free users and ANR rate belong next to engagement
- Check retention and opt-outs before calling an engagement win
What are app engagement metrics?
App engagement metrics measure how often people open a mobile app, how long and how deeply they use it, and whether they keep coming back. Downloads say how many people tried the app; engagement says whether it became part of their routine. They are the leading indicators for retention and revenue: an app whose engagement is falling will see churn a few weeks later.
The core app engagement metrics
| Metric | Formula | What it tells you |
|---|---|---|
| Daily active users (DAU) | Distinct users with a session that day | Size of the daily habit |
| Monthly active users (MAU) | Distinct users active in the last 30 days | Size of the active base |
| Stickiness | DAU ÷ MAU | How many monthly users come back on a given day |
| Sessions per user | Sessions ÷ active users in the period | Frequency of use |
| Session length | Time from start to background or timeout | Depth of a single use |
| Session interval | Time between two consecutive sessions | How habitual the app is |
| Screens per session | Screen views ÷ sessions | How far users go in one use |
| Engaged session rate | Engaged sessions ÷ all sessions | Share of opens that turn into real use |
| Retention (D1, D7, D30) | New users active again on day N ÷ new users | Whether the habit forms |
| Feature usage | Users of a feature ÷ active users | Which parts of the app carry engagement |
Two quality metrics belong next to them, because crashes and freezes destroy engagement: crash-free users (1 − users with a crash ÷ active users) and the ANR or freeze rate. Google Play treats a user-perceived crash rate above 1.09% or an ANR rate above 0.47% as bad behavior that can reduce an app's visibility.
| Metric | Formula |
|---|---|
| Stickiness | DAU ÷ MAU |
| Sessions per user | Sessions ÷ active users |
| Engaged session rate | Engaged ÷ all sessions |
| D7 retention | New users active on day 7 ÷ new users |
| Crash-free users | 1 − crash users ÷ active users |
Judge against the natural frequency of your app type.
What "good" engagement looks like
Benchmarks depend heavily on category. A messaging app should be opened several times a day; a travel app a few times a year. Rather than chase an industry number, set the expected frequency for your app's core job:
| App type | Natural frequency | Watch most closely |
|---|---|---|
| Messaging, social | Several times a day | Stickiness, sessions per day |
| Productivity, finance | Daily or weekdays | Weekday DAU/MAU, feature usage |
| Fitness, learning | Several times a week | Weekly active, streaks, session interval |
| Shopping | Weekly or monthly | Sessions per month, purchase frequency |
| Travel, utilities | Occasional | Retention over months, task completion |
Worked example: more opens, not more use
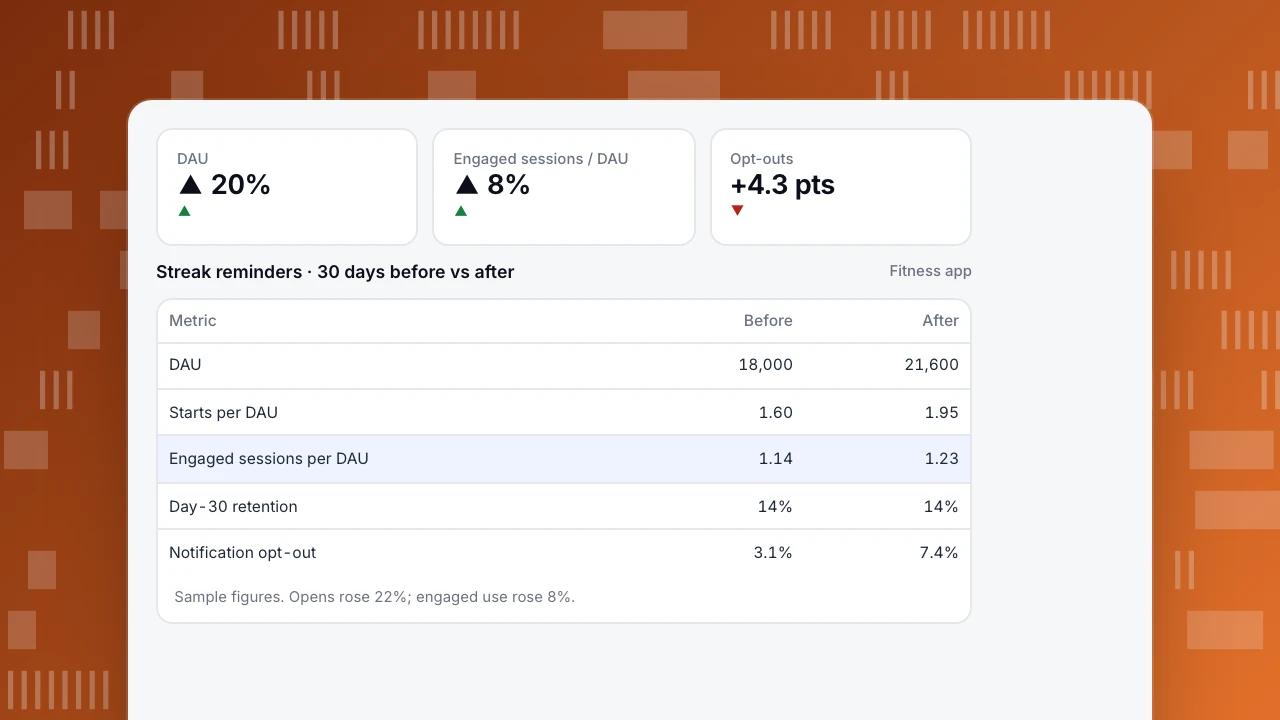
A fitness app added daily streak reminder notifications. Thirty days before and after (sample figures):
| Metric | Before | After | Change |
|---|---|---|---|
| DAU | 18,000 | 21,600 | +20% |
| MAU | 120,000 | 124,000 | +3% |
| Stickiness (DAU/MAU) | 15.0% | 17.4% | +2.4 pts |
| Starts per DAU | 1.60 | 1.95 | +22% |
| Engaged session rate | 71% | 63% | −8 pts |
| Engaged sessions per DAU | 1.14 | 1.23 | +8% |
| Median session length | 4 min 10 s | 3 min 05 s | −26% |
| Day-30 retention of new users | 14% | 14% | No change |
| Notification opt-out rate | 3.1% | 7.4% | +4.3 pts |
The headline numbers (DAU +20%, stickiness up) suggested a big win. The engagement detail told a different story: many of the extra opens were people tapping the notification, closing the streak, and leaving. Engaged sessions per active user rose only 8%, sessions got shorter, retention did not move, and more than twice as many users turned notifications off, which removes the channel for everything else.
The team kept the reminder but sent it only to users who had worked out at least twice in the previous week, and changed the copy to suggest a specific workout. Opt-outs fell back to 3.8% while engaged sessions per DAU held at 1.21.
DAU
▲ 20%
▲
Engaged sessions / DAU
▲ 8%
▲
Opt-outs
+4.3 pts
▼
Streak reminders · 30 days before vs after
Fitness app| Metric | Before | After |
|---|---|---|
| DAU | 18,000 | 21,600 |
| Starts per DAU | 1.60 | 1.95 |
| Engaged sessions per DAU | 1.14 | 1.23 |
| Day-30 retention | 14% | 14% |
| Notification opt-out | 3.1% | 7.4% |
Sample figures. Opens rose 22%; engaged use rose 8%.
How to improve app engagement
- Shorten time to value in onboarding: get new users to the core action in the first session.
- Find the habit-forming action. Compare retained and churned users: which action in week 1 separates them?
- Use notifications sparingly and personally, triggered by behavior, not by the calendar.
- Fix stability first. A crash in the first session is often the last session.
- Remove friction in the core loop, using screen paths and drop-offs to find where users leave.
- Measure engaged sessions, not starts, so a notification campaign cannot inflate the metric.
Measuring app engagement in TapCub
App analytics › Users › Users shows new users, active users (daily, weekly and monthly), starts and one-time starters, split by version and channel. App analytics › Users › Engagement shows the distributions of session duration, starts per user, interval between starts, screens per session and starts per day, plus a weekday-by-hour grid. In TapCub an engaged session lasts at least 10 seconds, includes at least two screens, or includes a key event. Retention is under Users › Retention, and crash-free users and freezes under Quality & attribution › Stability (Crash-free rate, Track app versions). Related reading: Mobile app KPIs and Engagement metrics.
See also: Session timeout.
See also: Increase app engagement, Mobile app analytics.
Sources
- Android Developers, Android vitals: user-perceived crash and ANR rate thresholds.
Was this article helpful?
We use your answers to fix and expand this page.
Couldn’t send. Please try again in a minute.
Thanks for the feedback. We’ll use it to improve this page.You’ve already sent feedback on this page. Thanks.

Technical Engineer
Focuses on tracking code, SDKs, and API integrations, with practical guidance on implementation checks and troubleshooting.