Try it on your own data
Every report in this article is in the free plan. One snippet for web and apps, up to 10 sites.
Start freeMobile app KPI lists run to 25 or 51 items, and the counting rules behind them are rarely stated. This guide picks a short set across growth, engagement, retention, quality and revenue, gives the formula for each, explains the rules that change the numbers, and shows how to read KPIs by version and install channel.
What you will learn
- Keep about a dozen app KPIs across five areas; leave downloads and rankings for store work
- Check counting rules first: reinstalls, multi-day actives, what counts as active, session timeout
- Read quality KPIs per release and retention per install channel
Pick a short set of mobile app KPIs
Lists of 25 or 51 mobile app KPIs are easy to find and hard to use. A team can review about a dozen numbers a week; beyond that, nothing gets acted on. The useful set covers five areas, growth, engagement, retention, quality and revenue, with two or three KPIs each.
Downloads and store ranking are left out of the core set on purpose. Both are useful for app store work, but neither tells you whether people who installed the app are getting value.
A weekly app KPI scorecard
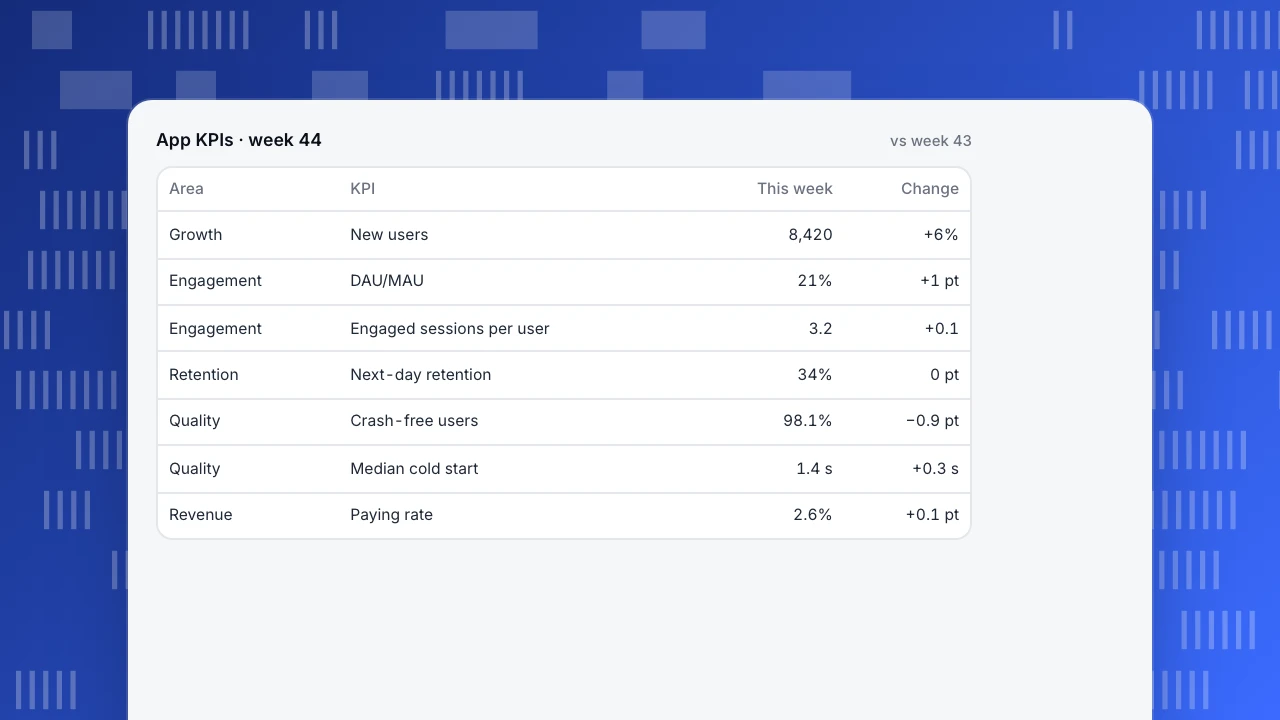
The example scorecard shows the shape: one row per KPI, this week's value and the change. In the sample week, new users and actives grew, next-day retention held, and crash-free users dropped after a release, which is the row to discuss first.
App KPIs · week 44
vs week 43| Area | KPI | This week | Change |
|---|---|---|---|
| Growth | New users | 8,420 | +6% |
| Engagement | DAU/MAU | 21% | +1 pt |
| Engagement | Engaged sessions per user | 3.2 | +0.1 |
| Retention | Next-day retention | 34% | 0 pt |
| Quality | Crash-free users | 98.1% | −0.9 pt |
| Quality | Median cold start | 1.4 s | +0.3 s |
| Revenue | Paying rate | 2.6% | +0.1 pt |
The KPIs and how to calculate them
The table lists the core mobile app KPIs with their formulas. Two are worth explaining further:
- Next-day retention is the share of new users who open the app again the next day. It is the fastest retention signal and reacts within a day of a release; for slower trends, add day-7 and day-30 retention by cohort, as described in retention metrics.
- DAU/MAU (stickiness) shows how many monthly users come on a typical day. It only makes sense for apps meant for frequent use.
| Area | KPI | Formula |
|---|---|---|
| Growth | New users | People seen for the first time (reinstalls excluded) |
| Growth | Activation rate | New users completing the key action ÷ new users |
| Engagement | DAU/MAU | Daily active ÷ monthly active |
| Engagement | Engaged sessions per user | Engaged sessions ÷ active users |
| Retention | Next-day retention | New users active the next day ÷ new users |
| Retention | Day-30 retention | Cohort active on day 30 ÷ cohort size |
| Quality | Crash-free users | 1 − crash users ÷ active users |
| Quality | Cold start (median) | Median launch-to-first-screen time |
| Revenue | Paying rate, ARPU | Buyers ÷ actives; revenue ÷ actives |
Write the counting rules next to each KPI before comparing tools.
Counting rules that change the numbers
The same app can report very different KPIs depending on a few rules. Check them before comparing tools or periods:
- Reinstalls. Is a person who deletes and reinstalls the app a new user? If yes, new users are inflated and retention is deflated.
- Multi-day actives. Summing daily active users over a week counts the same person up to seven times. Weekly active users must be deduplicated over the seven days.
- What counts as active. An app start, a screen view, or a meaningful action. Background refreshes should never count.
- Session timeout. When an app returns from the background, is that a new session? A 30-second timeout and a 30-minute one give very different session counts.
- Last-day effects. New users from the last day of a range cannot yet have a next-day value; they should be excluded, not counted as lost.
Quality KPIs
Quality is where app KPIs differ most from web metrics. Users rarely report crashes; they leave. Track:
- Crash-free users: 1 − users who had a crash ÷ active users. Watch it per release.
- ANRs and UI freezes: the main thread blocked long enough that the app stops responding.
- Cold start time: the median time from launch to a usable first screen.
A drop in engagement after a release is more often a quality problem than a design one. The product health metrics guide shows how to put quality next to growth and retention.
Read KPIs by version and channel
Two breakdowns explain most app KPI changes:
- By app version. Crash-free users, cold start and engagement per version show whether a release made things worse. Look at the share of active users on each version to know how much a problem matters.
- By install channel. New users and next-day retention per channel show which sources bring people who stay. A large channel with weak retention costs more than it appears.
Mobile app KPIs in TapCub
TapCub's app analytics defines the core KPIs precisely (app metrics). Active users are distinct people with a start or a screen view; a multi-day total is not deduplicated across days, while weekly and monthly actives are distinct over the previous 7 or 30 days. New users are people seen for the first time, and a reinstall is not a new user. Next-day retention is the share of new users who start again the next day, and new users from the last day wait until that day is over. An engaged session lasts at least 10 seconds, includes two screens or has a key event. Returning from the background records a new start only after the session timeout, 30 seconds by default.
The stability report shows crash-free users (1 − crash users ÷ active users), crashes, ANRs (Android, main thread blocked at least 5 seconds), UI freezes (iOS and HarmonyOS, at least 2 seconds) and median cold start (stability). Versions show each version's share of active users and crash count, and channels plot average daily new users against next-day retention. More on the app analytics page.
FAQ
What are the most important mobile app KPIs?
A short set across five areas: new users and activation (growth), DAU/MAU and engaged sessions (engagement), next-day and day-30 retention (retention), crash-free users and cold start (quality), and paying rate and ARPU (revenue).
How do you calculate mobile app retention rate?
Take a cohort of new users and divide the number who are active on day N by the cohort size. Next-day retention uses day 1.
Are downloads a good KPI?
They measure store performance, not product success. Track them for app store work, but judge the app on activation and retention.
What is a good crash-free users rate?
Track it against your own releases. A drop after a release is the signal to act, whatever the absolute level.
Should a reinstall count as a new user?
Usually not. Counting reinstalls as new inflates growth and makes retention look worse than it is.
See also: App engagement metrics, App retention rate.
See also: Mobile app analytics, Mobile app conversion rate, Mobile app optimization.
Was this article helpful?
We use your answers to fix and expand this page.
Couldn’t send. Please try again in a minute.
Thanks for the feedback. We’ll use it to improve this page.You’ve already sent feedback on this page. Thanks.

Solutions Engineer
Covers SDKs, API integrations, and data implementation, with an emphasis on validation, system interoperability, and troubleshooting.