Try it on your own data
Every report in this article is in the free plan. One snippet for web and apps, up to 10 sites.
Start freeThe mobile app customer journey runs from discovery and the store page through first open, first value, habit and payment to long-term retention. This guide lists eight stages with metrics, the mobile-specific moments that make or break them, and a shopping app where a mandatory account screen and an early location prompt hid products from a quarter of new users.
What you will learn
- Start the journey at the store page, not first open
- Show value before sign-up and permissions
- Use user-based funnels with time windows
- Split by platform and app version
- Plan relevant re-engagement
What is the mobile app customer journey?
The mobile app customer journey is the sequence of stages a person goes through with an app: discovering it, deciding to install from the store page, opening it for the first time, reaching first value, forming a habit, paying, and either staying or leaving. It differs from a website journey in three ways: there is a store page between interest and use, users must grant permissions that shape the experience, and the app competes for a place on the home screen and in notifications.
Mapping the journey with measurable stages shows where an app loses most people, which is usually much earlier than teams expect.
Stages of the mobile app customer journey
| Stage | What happens | Key metric |
|---|---|---|
| Discovery | Search, ads, social, word of mouth, store browsing | Store page views by source |
| Store decision | Screenshots, ratings, reviews, size | Store conversion (views → installs) |
| First open | Splash, permissions, sign-up or guest start | First-open rate (installs → opens), crashes on launch |
| Onboarding and first value | Personalization, first core action | Activation rate, time to value |
| Habit formation | Return visits in the first week | Day-1 and day-7 retention, sessions per user |
| Monetization | Paywall, trial, in-app purchase, ads | Trial start, conversion to paid, ARPU |
| Long-term retention | Ongoing use, updates, notifications | Day-30 retention, churn, uninstalls |
| Advocacy | Ratings, reviews, referrals | Rating, review volume, invites sent |
| Moment | Risk |
|---|---|
| Store page | Weak screenshots, crash reviews |
| First launch | Slow cold start, crashes |
| Permissions | Denied without context |
| First session | No value within minutes |
| Updates | A bad release breaks a stage |
Most apps lose the most users in the first session.
Mobile-specific moments that make or break the journey
- Store page. Screenshots and the first lines of the description decide installs; reviews mentioning crashes reduce them.
- Cold start. A slow or crashing first launch loses users before onboarding begins.
- Permission prompts. Asking for notifications or location without context gets denied, and on iOS a denied system prompt cannot be shown again in-app.
- First session length. Mobile sessions are short and interrupted; first value must fit into a few minutes.
- Notifications. The main way back into the app; overuse leads to opt-outs.
- Updates. Each release can improve or break the journey for everyone on that version.
- Cross-device. Some users discover on desktop and install later; links and QR codes bridge the gap.
How to map and measure the journey
- Define each stage as an event: install (from store data), $app_start, onboarding steps, the core action, purchase.
- Build a user-based funnel from first open to first value and to the first purchase, with time windows.
- Track cohorts by install week and acquisition source for retention.
- Split by platform and version. iOS and Android journeys differ; releases change them.
- Add qualitative signals: in-app chat questions, reviews and crash reports by stage.
Worked example: where a shopping app loses people
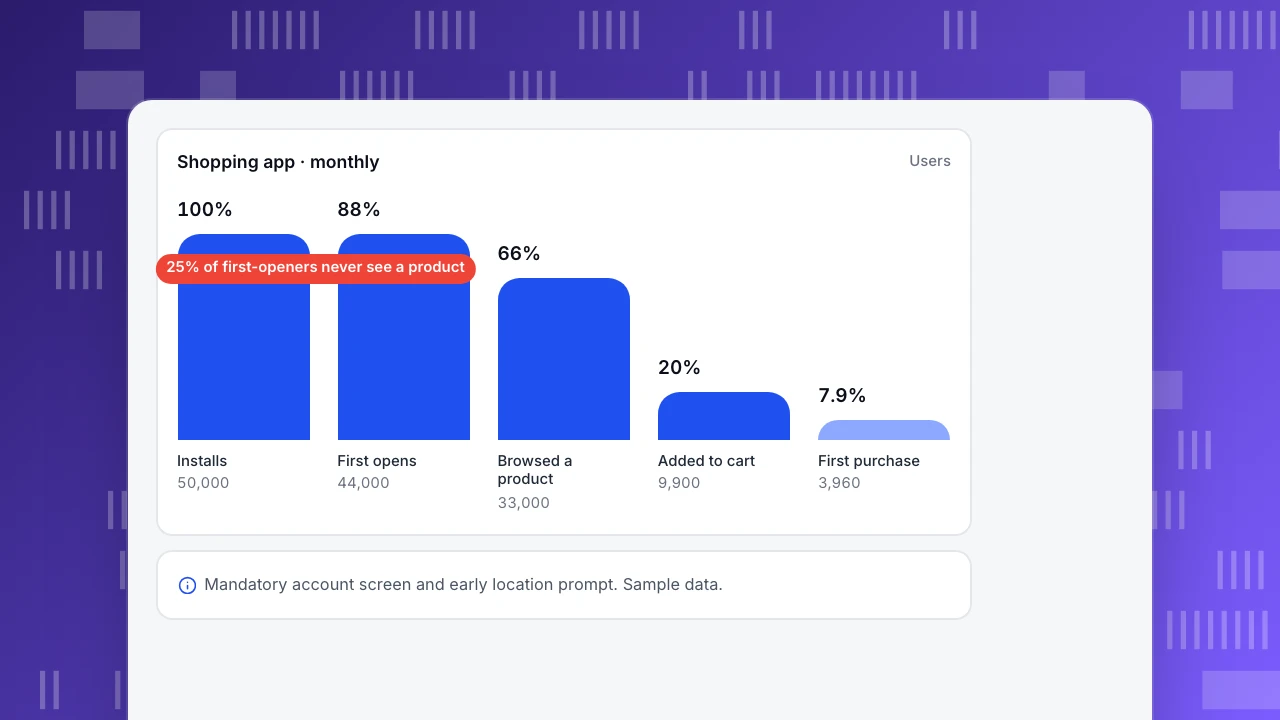
A shopping app (sample data), one month:
| Stage | Users | Rate |
|---|---|---|
| Store page views | 200,000 | — |
| Installs | 50,000 | 25% |
| First opens | 44,000 | 88% |
| Browsed a product | 33,000 | 75% |
| Added to cart | 9,900 | 30% |
| First purchase within 7 days | 3,960 | 40% of carts (7.9% of first opens) |
| Purchased again within 30 days | 1,190 | 30% of buyers |
Two stages stand out. 12% of installs never open the app (many installed from an ad and forgot), and 25% of first-openers never see a product: replays and crash data showed a mandatory account screen and a location prompt before any product appeared. Letting users browse first and asking for location only at delivery raised "browsed a product" to 88%; at the same downstream rates, that is about 690 more first purchases a month.
Shopping app · monthly
UsersInstalls
50,000
First opens
44,000
Browsed a product
33,000
Added to cart
9,900
First purchase
3,960
Common mistakes
- Starting the journey at first open. Store page and install data are part of it.
- Front-loading permissions and sign-up. Show value first.
- Ignoring version effects. A bad release can break one stage for everyone who updated.
- Session-based funnels for apps. Use user-based funnels with time windows; app journeys span many short sessions.
- No re-engagement plan. Without relevant reminders, the home screen is all users have to remember you.
Measuring the mobile journey in TapCub
- Funnels and retention: user-based funnels from $app_start and screen views to the core action and purchase; retention cohorts and lifecycle.
- Stability: crash-free users, ANRs and cold start by version, in the first-open stage especially.
- Versions and channels: compare versions; the $channel value set in your SDK groups users by distribution channel. TapCub does not attribute installs to ad clicks; use your store consoles or an attribution provider for that.
- In-app chat: questions asked at each stage, linked to the user's screens.
Related: app onboarding, mobile app conversion rate, increase app engagement, app retention rate.
FAQ
What are the stages of a mobile app customer journey? Discovery, store decision, first open, onboarding and first value, habit formation, monetization, long-term retention and advocacy.
How is the app journey different from a website journey? It includes the store page and install, permission prompts, notifications and app updates, and it usually spans many short sessions.
Where do apps lose most users? Usually in the first session: between install and first value. Crashes, mandatory sign-up and permission prompts are common causes.
Which metrics should I track first? Store conversion, first-open rate, activation rate and day-1 / day-7 retention.
Sources
- Apple Developer. Product page optimization.
- Android Developers. Request runtime permissions.
- Android Developers. App startup time.
Was this article helpful?
We use your answers to fix and expand this page.
Couldn’t send. Please try again in a minute.
Thanks for the feedback. We’ll use it to improve this page.You’ve already sent feedback on this page. Thanks.

Product Adoption Consultant
Explores customer onboarding, live conversations, and self-service, turning common usage questions into practical guidance and improvements.