Try it on your own data
Every report in this article is in the free plan. One snippet for web and apps, up to 10 sites.
Start freeReal user monitoring shows how fast your site is for the people who actually use it, but its data mixes every device and network. This guide explains RUM vs synthetic tests, why P75 by device is the default view, how small samples mislead, and how to turn a slow segment into a fix.
What you will learn
- RUM measures real visits; synthetic tests catch regressions before release
- Read P75 split by device, then by page and country
- Note sample sizes, and remember RUM misses visits where the script never ran
What real user monitoring is
Real user monitoring (RUM) records how fast pages load and respond in your visitors' own browsers, on their devices and networks. A small script reads timings the browser already measures and sends them with each page view (MDN). The result is a distribution of experiences rather than one number from a test machine.
That is its strength and its difficulty. RUM tells you what people actually got, but it mixes fast laptops on fibre with old phones on mobile data, so reading it takes a few rules.
RUM vs synthetic monitoring
Synthetic monitoring loads a page from a controlled machine on a schedule. It is repeatable and good for catching regressions before release. RUM is what users experience after release, including devices, networks and countries you would not test. Most teams need both: synthetic tests to stop slow builds shipping, RUM to see whether real visitors are affected and where. The table compares them.
| Real user monitoring | Synthetic monitoring | |
|---|---|---|
| Source | Visitors' browsers | Controlled test machines |
| Coverage | All devices, networks, countries | Configured locations and devices |
| When | After release, continuously | Before and after release, on schedule |
| Good for | Real impact, segments, trends | Regressions, repeatable comparisons |
| Blind spots | Blocked scripts, early leavers | Conditions you did not configure |
Most teams use both.
Read percentiles, not averages
Load times have a long tail: a few very slow loads pull an average up. RUM tools report percentiles instead:
- P50 (median): the typical visit.
- P75: three in four visits are at least this fast. Google's Web Vitals guidance uses the 75th percentile of page loads, segmented by mobile and desktop, to decide whether a site meets the thresholds (web.dev).
- P95 / P99: the slowest visits, useful for finding broken cases.
The thresholds for the core metrics are: largest contentful paint (LCP) good at 2.5 s or less, poor above 4 s; interaction to next paint (INP) good at 200 ms or less, poor above 500 ms; cumulative layout shift (CLS) good at 0.1 or less, poor above 0.25 (web.dev). See Web Vitals.
Read by device and page
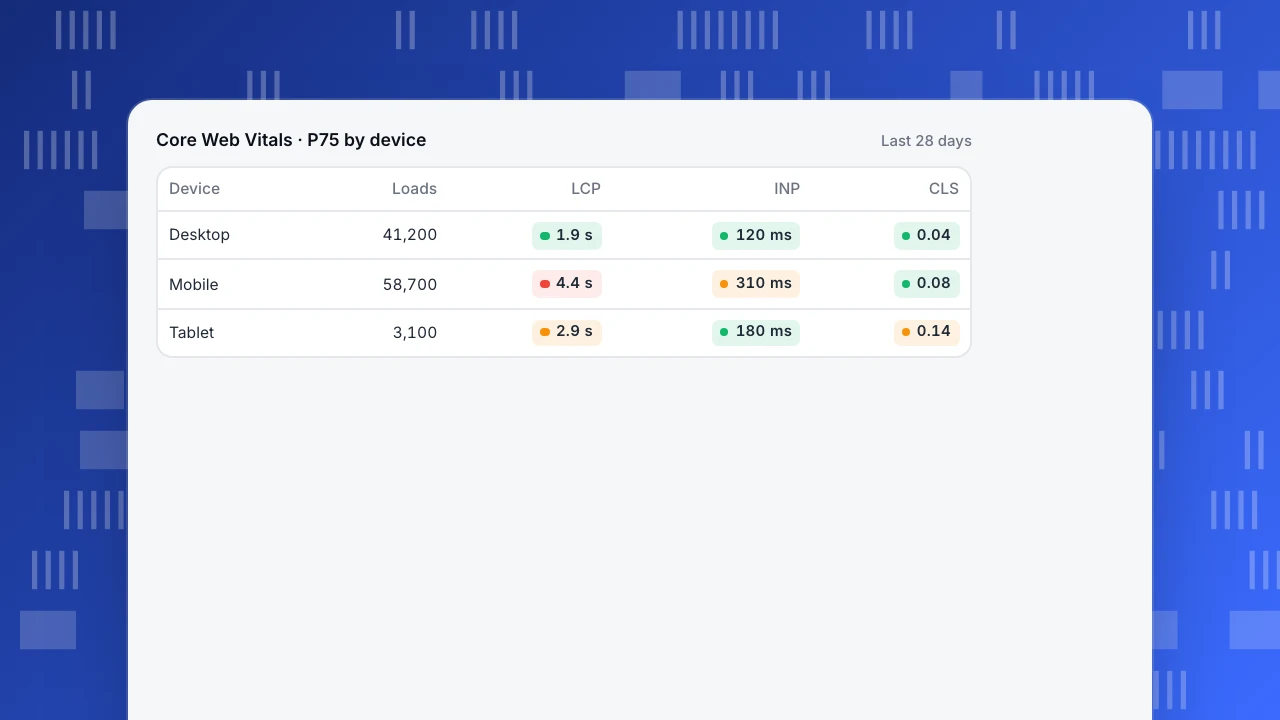
A site-wide P75 hides the segments that matter. Split by device first: mobile is usually where problems are. In the example, desktop passes on all three metrics while mobile LCP is poor and INP needs improvement. The site-wide number would have looked merely average.
Then break the slow segment down by page, country and browser. A slow template (product pages, say) or one country far from your servers usually explains most of it.
Watch the sample size. A page with 40 loads can swing its P75 by a second from one week to the next. Note the sample count next to each percentile and wait for enough data before acting.
Core Web Vitals · P75 by device
Last 28 days| Device | Loads | LCP | INP | CLS |
|---|---|---|---|---|
| Desktop | 41,200 | 1.9 s | 120 ms | 0.04 |
| Mobile | 58,700 | 4.4 s | 310 ms | 0.08 |
| Tablet | 3,100 | 2.9 s | 180 ms | 0.14 |
From slow segment to fix
- Find the slowest segment by P75 with a meaningful number of samples.
- Split load time into backend (time to first byte), network and front-end rendering to see where the time goes.
- Reproduce it in a lab test with matching device and network throttling.
- Fix, ship, and compare the same segment's P75 over the following weeks.
- Check whether people stay: compare bounce and exit rates for the page before and after.
What RUM cannot see
RUM needs the script to run. Visits where it is blocked, and pages so slow that people leave before it loads, are missing, so the slowest experiences are under-counted. It also cannot tell you why a page is slow; that takes lab tools and traces. And metrics depend on browser support, so some browsers report fewer of them.
Real user monitoring in TapCub
TapCub's Performance report uses real loads in visitors' browsers, not a lab run. It shows five metrics with good and poor thresholds: LCP (2.5 s / 4 s), CLS (0.1 / 0.25), INP (200 ms / 500 ms), first contentful paint (1.8 s / 3 s) and time to first byte (800 ms / 1.8 s). Cards switch among P95, P75, median and average; trends and breakdowns use P50, P75, P90 or P99, by page, country, device, browser and operating system (performance).
Load timing splits into backend, network transfer and front-end render, and a Slowest pages list is sorted by P75 LCP. Percentiles jump when a page has few samples, and if the script is blocked the page is empty rather than filled with server times. Script errors are a separate report. For page-level behaviour on slow pages, see how to read a heatmap and analytics metrics.
FAQ
What is real user monitoring?
Measuring page speed and responsiveness from real visitors' browsers, as opposed to tests run from a controlled machine.
What is the difference between RUM and synthetic monitoring?
Synthetic monitoring runs scripted tests on a schedule; RUM records what actual visitors experienced. Synthetic catches regressions before release, RUM shows real impact.
Why use P75 instead of the average?
Load times have a long tail that distorts the average. P75 reflects the experience of most visitors, including slower ones, and is what Web Vitals guidance uses.
What metrics does RUM collect?
Typically Core Web Vitals (LCP, INP, CLS) plus first contentful paint, time to first byte and load timing breakdowns.
Does RUM slow down my site?
A well-built RUM script is small and sends data after the page loads or when it is hidden, so the effect is minimal.
See also: Web performance monitoring.
See also: Website optimization.
Was this article helpful?
We use your answers to fix and expand this page.
Couldn’t send. Please try again in a minute.
Thanks for the feedback. We’ll use it to improve this page.You’ve already sent feedback on this page. Thanks.

Technical Engineer
Focuses on tracking code, SDKs, and API integrations, with practical guidance on implementation checks and troubleshooting.