Try it on your own data
Every report in this article is in the free plan. One snippet for web and apps, up to 10 sites.
Start freeWebsite optimization is the ongoing work of making a site faster, easier to find and easier to use, so more visitors complete their goal. This guide splits it into four layers (performance, search, user experience and conversion), shows how to find the bottleneck for a page, and walks through a landing page where three small fixes lifted trials by about a third.
What you will learn
- Optimize four layers: performance, search, UX and conversion
- Start with the pages that get the most entrances
- Use real-user Core Web Vitals, not only lab scores
- Change one thing at a time and annotate the date
- Re-measure after every release
What is website optimization?
Website optimization is the ongoing work of making a site faster, easier to find and easier to use, so that more of the people who arrive do what they came for: read, sign up, buy or get in touch. It covers four layers that depend on each other: performance (how fast pages load and respond), search visibility (whether search engines can crawl, index and rank the pages), user experience (whether visitors can find and understand things), and conversion (whether the path to the goal has unnecessary friction).
Optimizing one layer while another is broken rarely pays off. A beautifully rewritten landing page will not convert visitors who leave before it renders, and a fast page that ranks for the wrong query attracts the wrong people. The useful question is always: which layer is the bottleneck for this page right now?
Why it matters
- Speed changes behavior. Google's research on mobile pages found that as load time goes from one second to three, the probability of a bounce rises by about a third. Slow pages lose visitors before your content has a chance.
- Search traffic compounds. A page that is indexable, matches intent and loads well keeps earning visits for years; fixing a crawl or indexing problem can lift every page in a section at once.
- Small frictions add up. A confusing form field or a hidden price costs a few percent at one step, and funnels multiply those losses.
- It is cheaper than buying traffic. Converting more of the visitors you already have lowers the cost of every channel.
The four layers and what to measure
| Layer | Question it answers | Main metrics | Typical fixes |
|---|---|---|---|
| Performance | Does the page load and respond quickly on real devices? | LCP, INP, CLS, TTFB (75th percentile, field data) | Compress images, cut render-blocking scripts, cache, preload the hero |
| Search visibility | Can people find the page in search? | Indexed pages, impressions, average position, CTR | Fix crawl errors, titles that match the query, internal links |
| User experience | Can visitors find and understand what they need? | Bounce rate, scroll depth, rage clicks, exits | Clearer navigation, readable layout, fix broken elements |
| Conversion | Does the path to the goal work? | Goal conversion rate, funnel step drop-off | Shorter forms, visible prices, trust signals near the CTA |
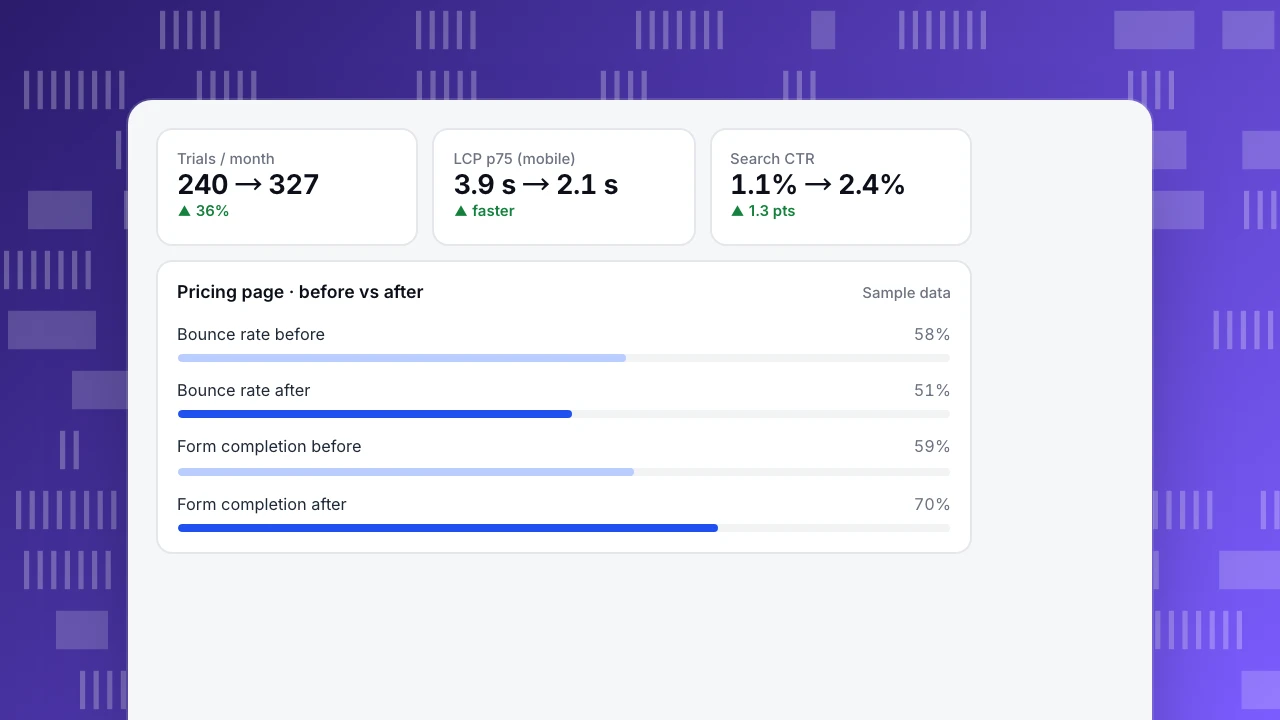
Trials / month
240 → 327
▲ 36%
LCP p75 (mobile)
3.9 s → 2.1 s
▲ faster
Search CTR
1.1% → 2.4%
▲ 1.3 pts
Pricing page · before vs after
Sample dataHow to optimize a website in six steps
1. Pick one goal per page type
Write down what success means for each template: a blog post (scroll to the end, click to a product page), a pricing page (start a trial), a checkout (complete payment). Without a goal you cannot tell whether a change helped.
2. Find the pages that matter
Sort pages by entrances and by revenue or sign-ups. In most sites a small number of landing pages receive most of the traffic. Start there: a 10% improvement on a page with 20,000 monthly entrances beats a redesign of a page nobody lands on.
3. Measure a baseline for each layer
For each priority page record four weeks of: Core Web Vitals at the 75th percentile from real users, search impressions and position, bounce and exit rates, and goal conversion. Field data matters: lab tests on a fast laptop miss what mid-range phones on mobile networks experience.
4. Find the bottleneck
Go layer by layer. If LCP is above 2.5 seconds or INP above 200 ms, performance comes first. If the page has impressions but almost no clicks, the title and description do not match the query. If people arrive but leave without scrolling, the top of the page is not answering their question. If they reach the form but do not finish, look at the form.
5. Change one thing and measure
Make one change per page at a time, annotate the date, and compare the same weekdays before and after. For conversion changes on high-traffic pages, a controlled A/B test is more reliable than a before/after comparison; on smaller sites, a longer before/after window with a clear annotation is the realistic option.
6. Repeat on a schedule
Optimization is not a project with an end. Re-check priority pages monthly and after every release: new scripts, new templates and new content are the usual reasons a fast, converting page gets worse.
| Symptom | Likely layer | Look at first |
|---|---|---|
| Visitors leave before the page renders | Performance | LCP and TTFB at p75 on mobile |
| Impressions but few clicks | Search | Title and description vs the query |
| Arrive but do not scroll | User experience | Above-the-fold content, scroll depth |
| Start the form but do not finish | Conversion | Field-level drop-off, required fields |
Go layer by layer: a conversion fix will not help visitors who never see the page.
Worked example: one landing page, three fixes
A B2B pricing page (sample data) receives 12,000 entrances a month and converts 2.0% of them into trials: 240 trials.
| Step | Finding | Change | Result after 4 weeks |
|---|---|---|---|
| Performance | LCP 3.9 s at p75 on mobile; hero image 1.4 MB | Served the hero as a 180 KB WebP and preloaded it | LCP 2.1 s; bounce rate 58% → 51% |
| Search | Position 7 for "pricing analytics software", CTR 1.1% | Rewrote the title to state price and free tier | CTR 2.4%; entrances +9% |
| Conversion | 41% of form starters stopped at "company size" | Made the field optional | Form completion 59% → 70% |
Combined, trials went from 240 to roughly 330 a month (12,000 × 1.09 entrances × 2.5% conversion ≈ 327). None of the fixes required a redesign. Each one came from looking at a different layer.
Common website optimization mistakes
- Optimizing lab scores instead of real users. A perfect Lighthouse score on a desktop test can coexist with poor field LCP on phones.
- Changing everything at once. A redesign that ships ten changes cannot tell you which one helped and which one hurt.
- Ignoring tracking changes. A new consent banner or tag manager edit can move bounce and conversion rates more than any content change. Annotate them.
- Chasing traffic that does not convert. More visits from the wrong query make conversion rates look worse while revenue stays flat.
- Treating mobile as an afterthought. For most sites, more than half of visits come from phones; test the mobile layout first.
- Stopping after the first win. Performance regresses with every new script; re-measure after releases.
Website optimization in TapCub
TapCub covers three of the four layers with real-user data from the same script:
- Performance: open Monitoring › Performance to see LCP, INP, CLS, TTFB and FCP at the 75th percentile by page, device and country, collected from real visits. See check Core Web Vitals.
- Behavior: in Web analytics › Pages, sort by entrances, then check bounce rate, exits and time on page; from a page row you can open its click map. Heatmaps and session replay show rage clicks and where people stop scrolling (replay is off by default and samples 10% of sessions when enabled).
- Conversion: define a goal for the page (a path, an event or a revenue event) and build a funnel to see which step loses people.
- Search: connect Google Search Console to see impressions, position and CTR by page and query next to your traffic.
TapCub does not run A/B tests; use your testing tool for that and compare the results in TapCub by annotating the test dates.
FAQ
What is the difference between website optimization and SEO? SEO is one part of website optimization: it improves how pages are crawled, indexed and ranked. Website optimization also covers speed, usability and conversion, which affect what visitors do after they arrive.
How do I know which page to optimize first? Pick pages with many entrances and a clear business goal, then look for the biggest gap: slow LCP, low search CTR, high bounce, or a funnel step that loses most people.
How long does it take to see results? Speed and conversion changes show in a week or two of data for busy pages. Search changes usually take several weeks because pages have to be recrawled and re-evaluated.
Do I need an A/B test for every change? No. Use A/B tests for conversion changes on pages with enough traffic to reach significance. Bug fixes and speed improvements can be validated with before/after data.
Sources
- Google Search Central. SEO starter guide.
- web.dev. Web Vitals and Optimize Largest Contentful Paint.
- Think with Google. Find out how you stack up to new industry benchmarks for mobile page speed.
- Baymard Institute. Checkout usability research.
Was this article helpful?
We use your answers to fix and expand this page.
Couldn’t send. Please try again in a minute.
Thanks for the feedback. We’ll use it to improve this page.You’ve already sent feedback on this page. Thanks.

Product Experience Specialist
Explores usability, user journeys, and feature adoption through practical examples of onboarding and everyday product use.